

Question: Can someone help construct a table using a data set in Excel or Google sheet? Question: Consider the claim that the average annual miles on
Can someone help construct a table using a data set in Excel or Google sheet?
Question: Consider the claim that the average annual miles on the car driven by a driver in the given population is different from 9000. Use the data collected for the variable "Annual.miles.drive" to test this claim by both critical value approach and p-value approach. (Use the 5% level of significance).
The Confidence interval of the difference is: 94%
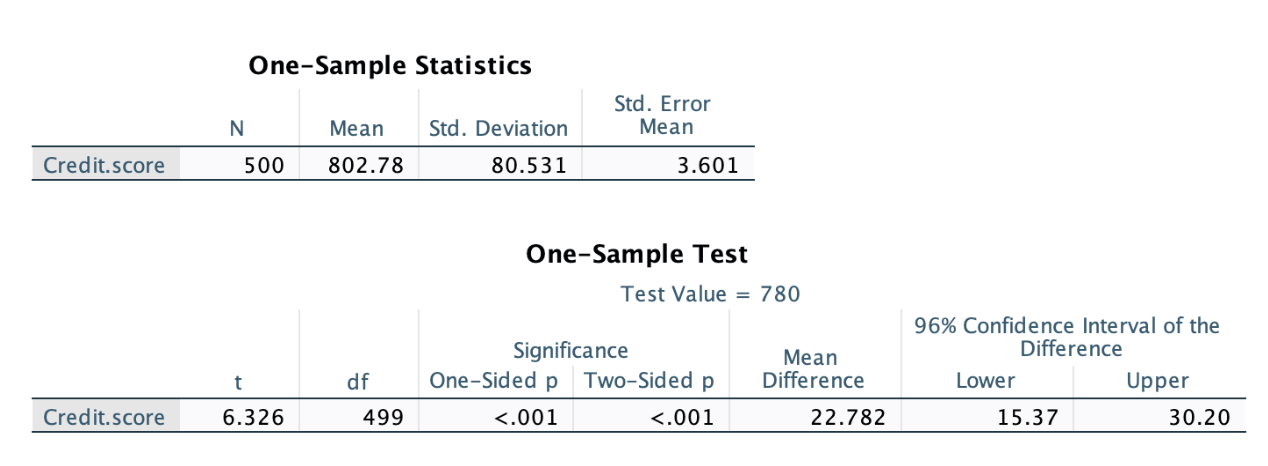
This is what the table should look like (this is an example):

One-Sample Statistics Std. Error N Mean Std. Deviation Mean Credit.score 500 802.78 80.531 3.601 One-Sample Test Test Value = 780 96% Confidence Interval of the Significance Mean Difference t df One-Sided p Two-Sided p Difference Lower Upper Credit.score 6.326 499 <.001>
Step by Step Solution
There are 3 Steps involved in it

Get step-by-step solutions from verified subject matter experts