

Question: fQuestion 2 Identify the class width for the given Frequency Distribution Table List 10 to 14 27 15 to 19 35 20 to 24 14


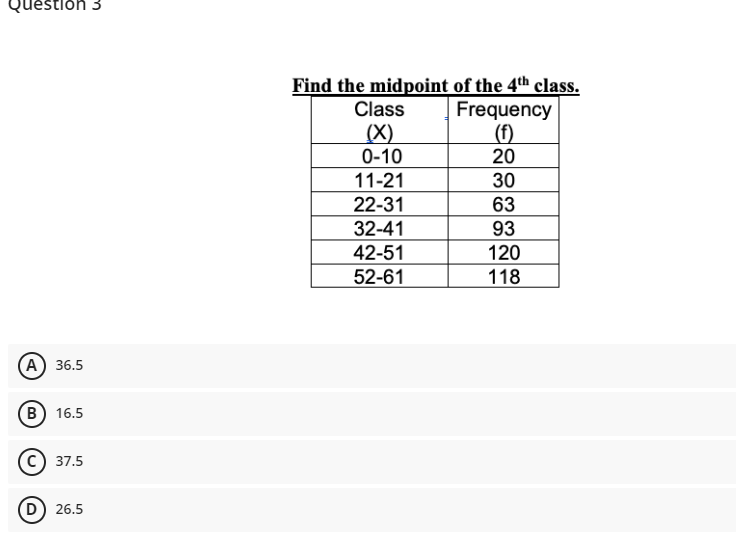
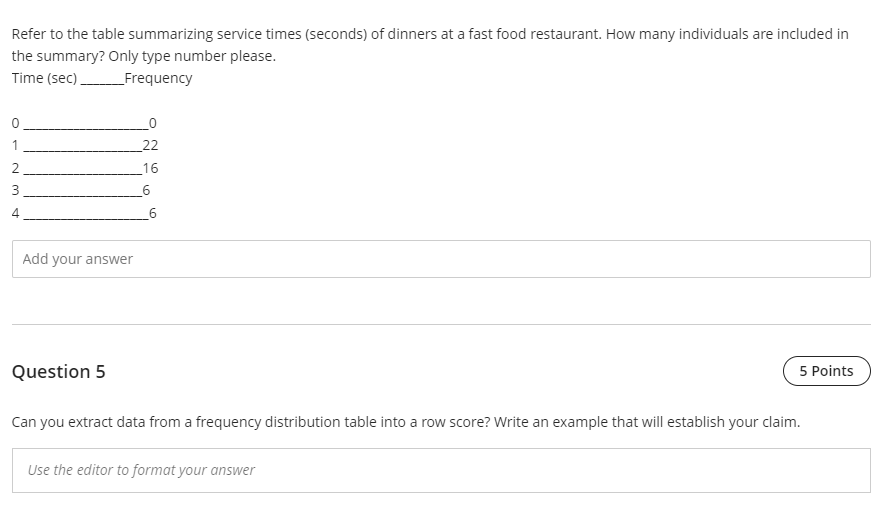
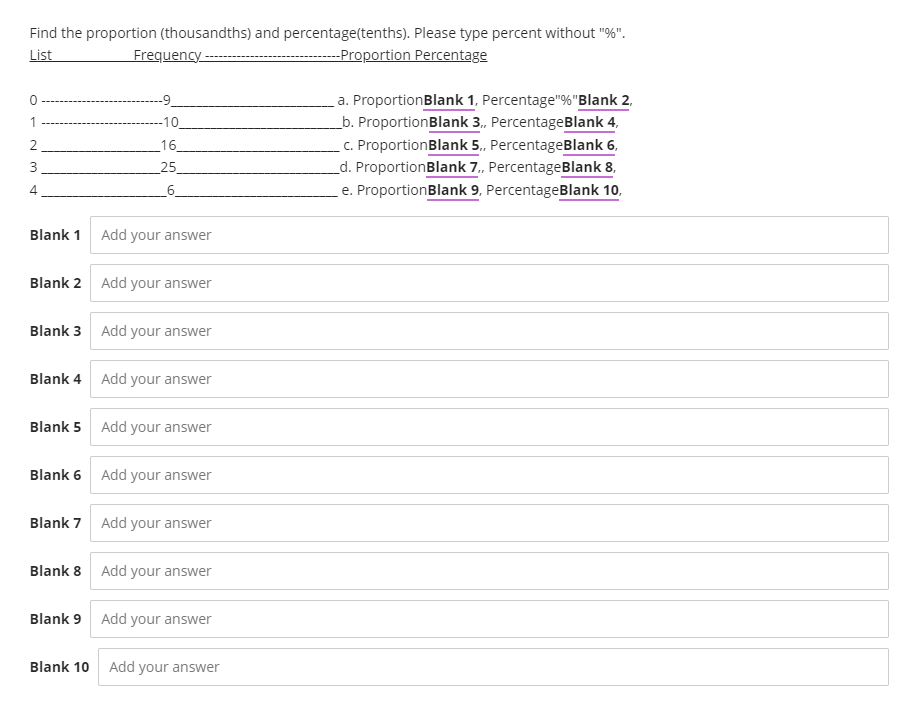

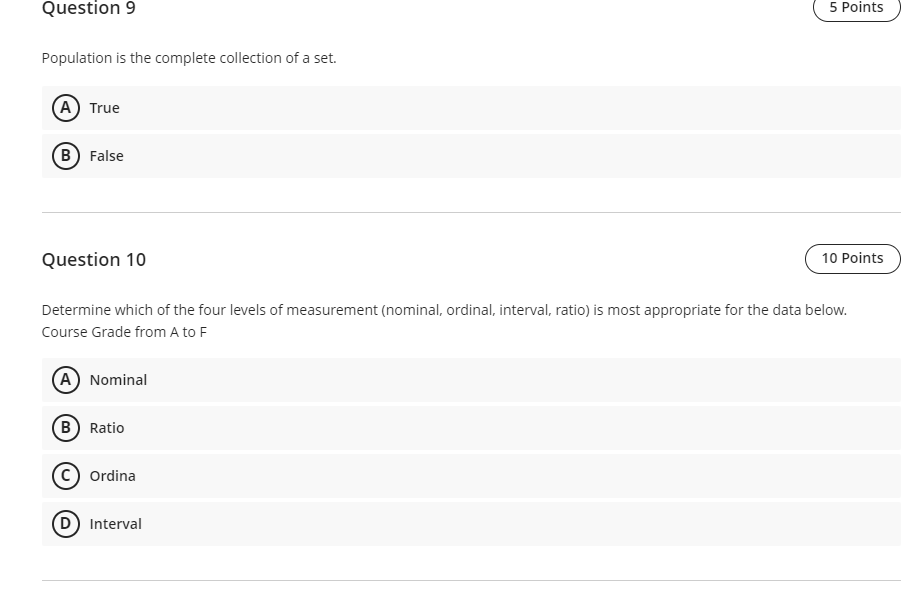
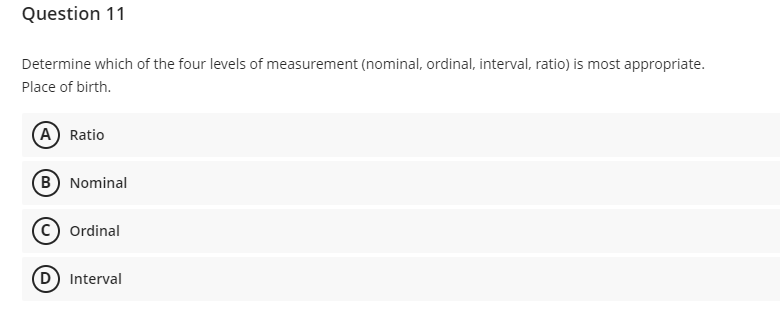
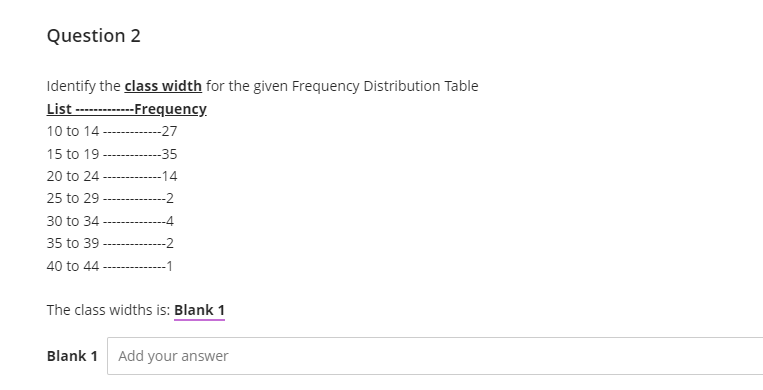


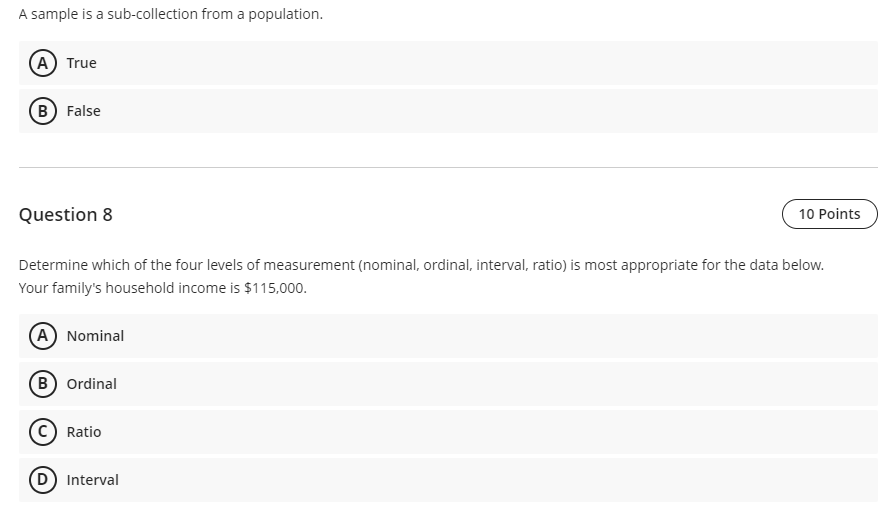


\fQuestion 2 Identify the class width for the given Frequency Distribution Table List 10 to 14 27 15 to 19 35 20 to 24 14 25 to 29 2 30 to 34 4 35 to 39 2 40 to 44 The class widths is: Blank 1 Blank 1 Add your answer\fRefer to the table summarizing service times [second 5) of dinners at a fast food restaurant. How many individuals are included in the summary? Only type number please. Time {sec} Frequency D G 1 22 2 1 6 3 E 4 6 Add your answer Question 5 l[an you extract data from a frequency distribution table into a row score? Write an example that will establish your claim. Use the editor to format your answer Find the proportion (thousandths) and percentage(tenths). Please type percent without "". List Frequency --. -Proportion Percentage a. ProportionBlank 1, Percentage"%"Blank 2, -10 b. ProportionBlank 3., PercentageBlank 4. 16 c. ProportionBlank 5,, PercentageBlank 6, 3 25 d. ProportionBlank 7., PercentageBlank 8, A 6 e. ProportionBlank 9, PercentageBlank 10, Blank 1 Add your answer Blank 2 Add your answer Blank 3 Add your answer Blank 4 Add your answer Blank 5 Add your answer Blank 6 Add your answer Blank 7 Add your answer Blank 8 Add your answer Blank 9 Add your answer Blank 10 Add your answerA sample is a sub-collection from a population. True B False Question 8 10 Points Determine which of the four levels of measurement (nominal, ordinal, interval, ratio) is most appropriate for the data below. Your family's household income is $115,000. A Nominal B Ordinal Ratio IntervalQuestion?) i 5Points 1 Population is the complete collection of a set. Question 10 Determine which of the four levels of measurement (nominal, ordinal, interval, ratio] is most appropriate forthe data below. Course Grade from A to F Question 11 Determine which of the four levels of measurement (nominal, ordinal, interval, ratio) is most appropriate. Place of birth. A Ratio B Nominal C Ordinal D Interval
Step by Step Solution
There are 3 Steps involved in it

Get step-by-step solutions from verified subject matter experts