

Question: Can someone help me explain some changes that have happened with the operating activities from 2020 to 2021. Operating Activities Fiscal year is January-December. All
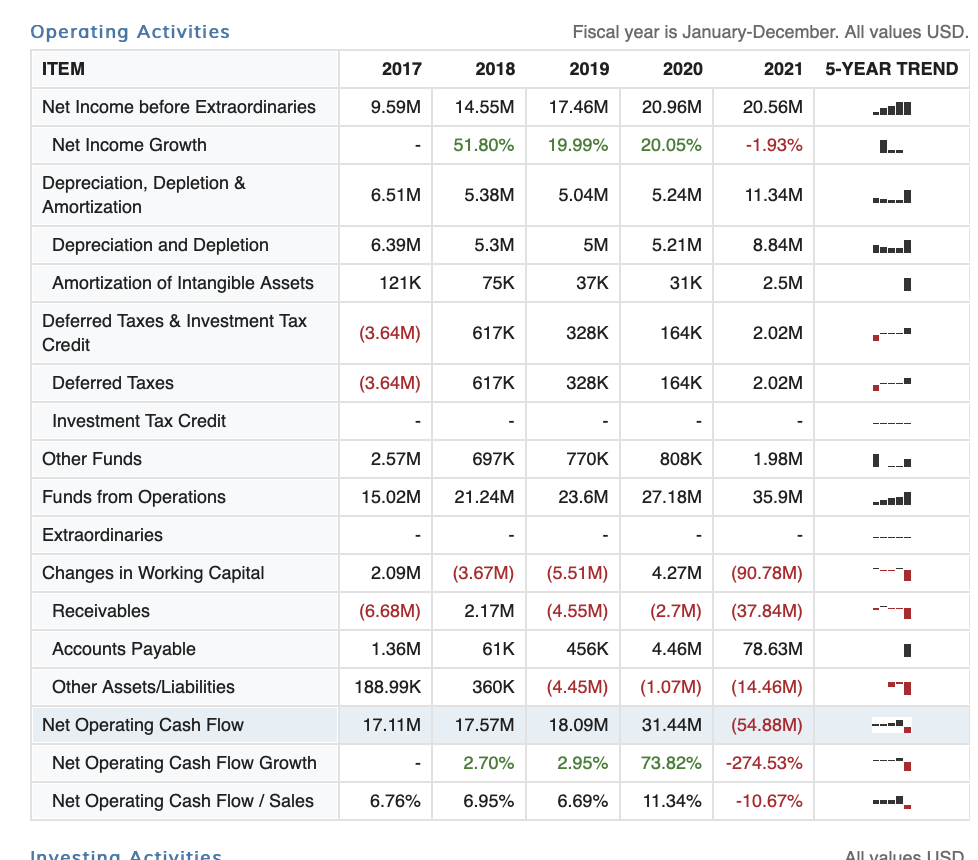
Can someone help me explain some changes that have happened with the operating activities from 2020 to 2021.
Operating Activities Fiscal year is January-December. All values USD. ITEM 2017 2018 2019 2020 2021 5-YEAR TREND Net Income before Extraordinaries 9.59M 14.55M 17.46M 20.96M 20.56M Net Income Growth 51.80% 19.99% 20.05% -1.93% L. Depreciation, Depletion & Amortization 6.51M 5.38M 5.04M 5.24M 11.34M Depreciation and Depletion 6.39M 5.3M 5M 5.21M 8.84M Amortization of Intangible Assets 121K 75K 37K 31K 2.5M . Deferred Taxes & Investment Tax Credit (3.64M) 617K 328K 164K 2.02M Deferred Taxes (3.64M) 617K 328K 164K 2.02M Investment Tax Credit Other Funds 2.57M 697K 770K 808K 1.98M LI Funds from Operations 15.02M 21.24M 23.6M 27.18M 35.9M Extraordinaries Changes in Working Capital 2.09M (3.67M) (5.51M) 4.27M (90.78M) Receivables (6.68M) 2.17M (4.55M) (2.7M) (37.84M) 1 Accounts Payable 1.36M 61K 456K 4.46M 78.63M 1 Other Assets/Liabilities 188.99K 360K (4.45M) (1.07M) (14.46M) 17.11M 17.57M 18.09M 31.44M (54.88M) --- Net Operating Cash Flow Net Operating Cash Flow Growth 2.70% 2.95% 73.82% -274.53% Net Operating Cash Flow / Sales 6.76% 6.95% 6.69% 11.34% -10.67% Investing Activities All values USD
Step by Step Solution
There are 3 Steps involved in it

Get step-by-step solutions from verified subject matter experts