

Question: Can someone help me make a chart for this data.. ...or tell me how.the ..second question? A B c G H I J K L
Can someone help me make a chart for this data.. ...or tell me how.the ..second question?
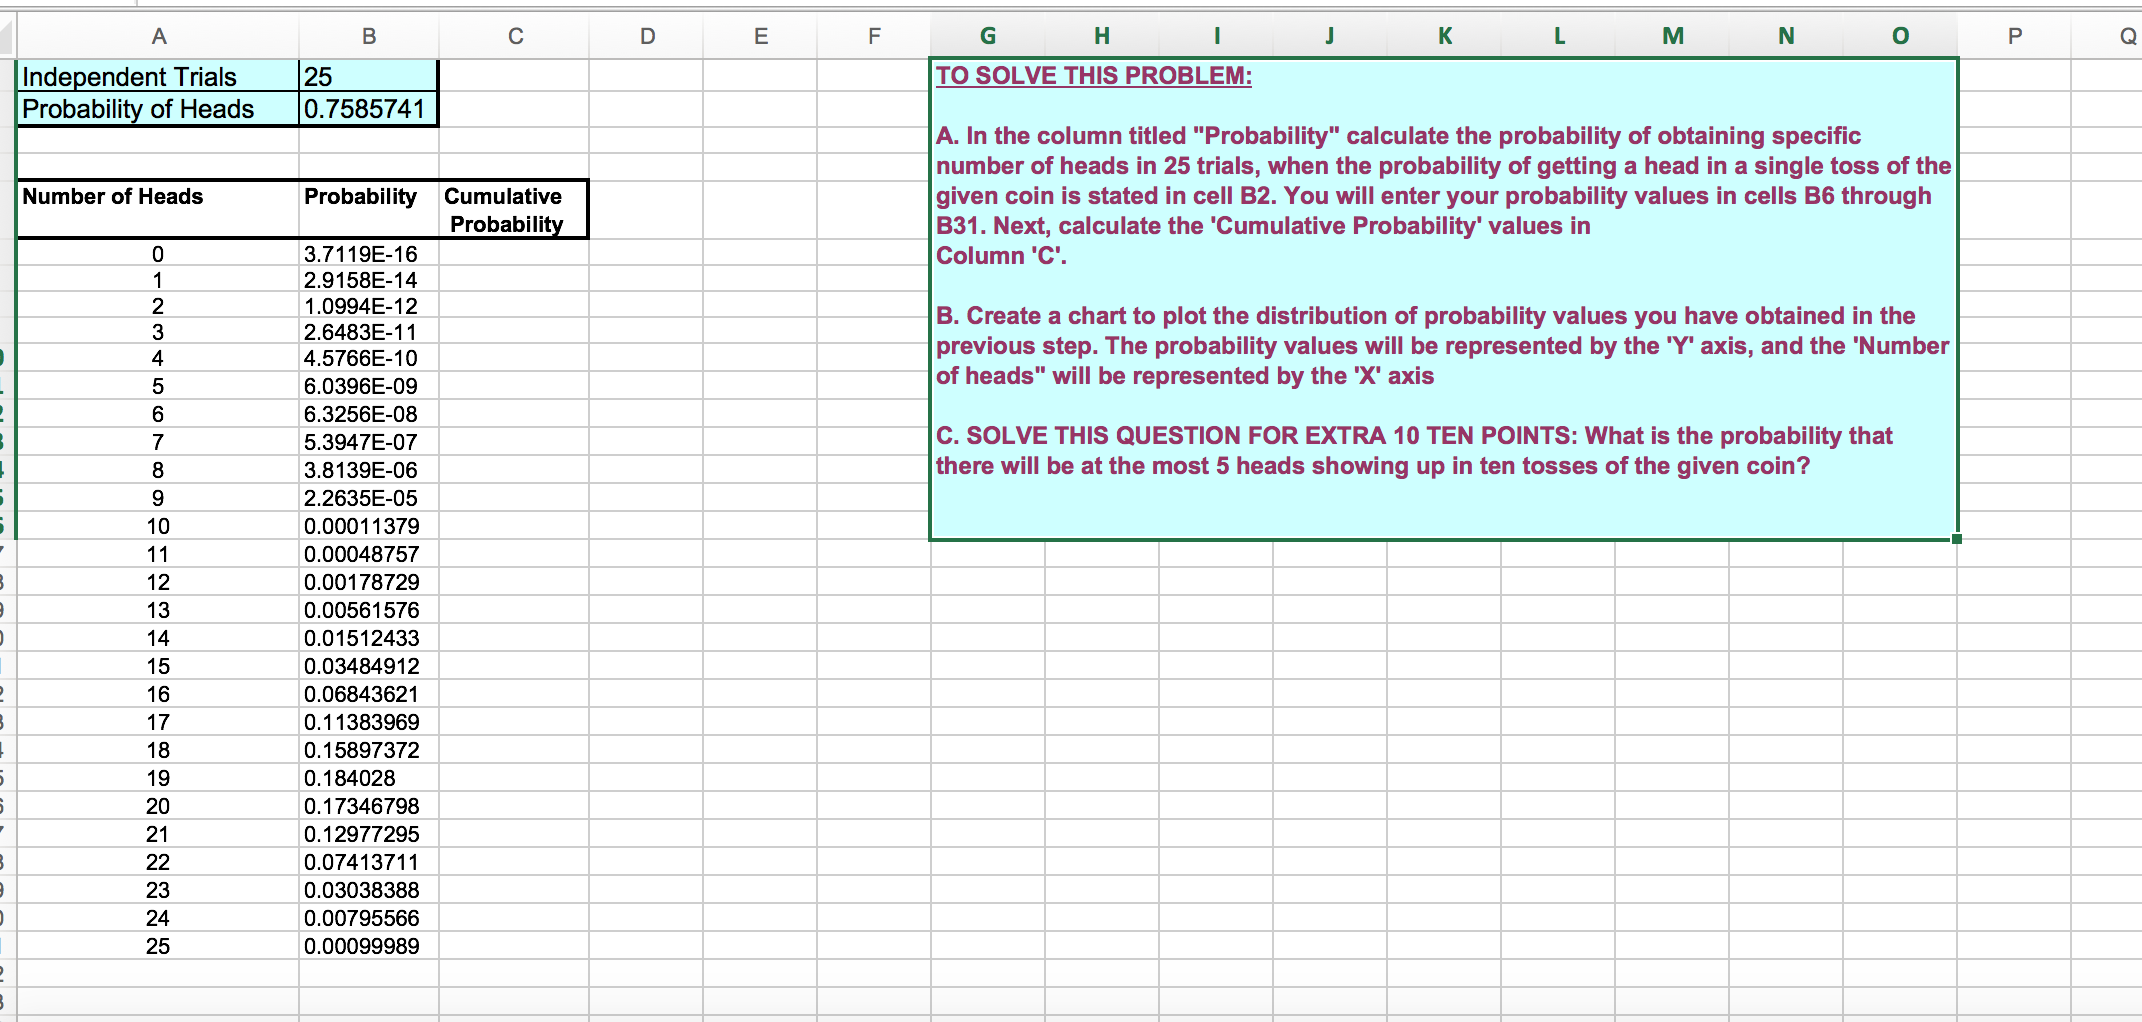
A B c G H I J K L M N O Q Independent Trials 25 W Probabili of Heads 0.7585741 A. In the column titled "Probability" calculate the probability of obtaining specic number of heads in 25 trials, when the probability of getting a head in a single toss of the Number of Heads Probability Cumulative given coin is stated in cell BZ. You will enter your probability values in cells BE through Probabili B31. Next, calculate the '6umulative Probability' values in 0 3.7119516 Column '6'. _ 1 2.9158514 g $223351: B. Create a chart to plot the distribution of probability values you have obtained in the 4 4.5766510 previous step. The probability values will be represented by the 'Y' axis, and the 'Number 5 6.0396509 of heads" will be represented by the 'X' axis 6 6.3256505 7 539475.07 c. SOLVE THIS QUESTION FOR EXTRA 1o TEN POINTS: What is the probability that a 331395.05 there will be at the most 5 heads showing up in ten tosses of the given coin? 9 2.2635505 10 000011379 11 0.00048757 12 0.00178729 13 0.00561576 14 0.01512433 15 0.03484912 16 0.06543621 17 0.11383969 18 0.15597372 19 0.154025 20 0.17346795 21 0.12977295 22 0.07413711 23 003038355 24 0.00795566 25 000099959
Step by Step Solution
There are 3 Steps involved in it

Get step-by-step solutions from verified subject matter experts