

Question: Can someone help me make the graph which is the first picture on the right? The second picture is information to help plot the graph.
Can someone help me make the graph which is the first picture on the right?
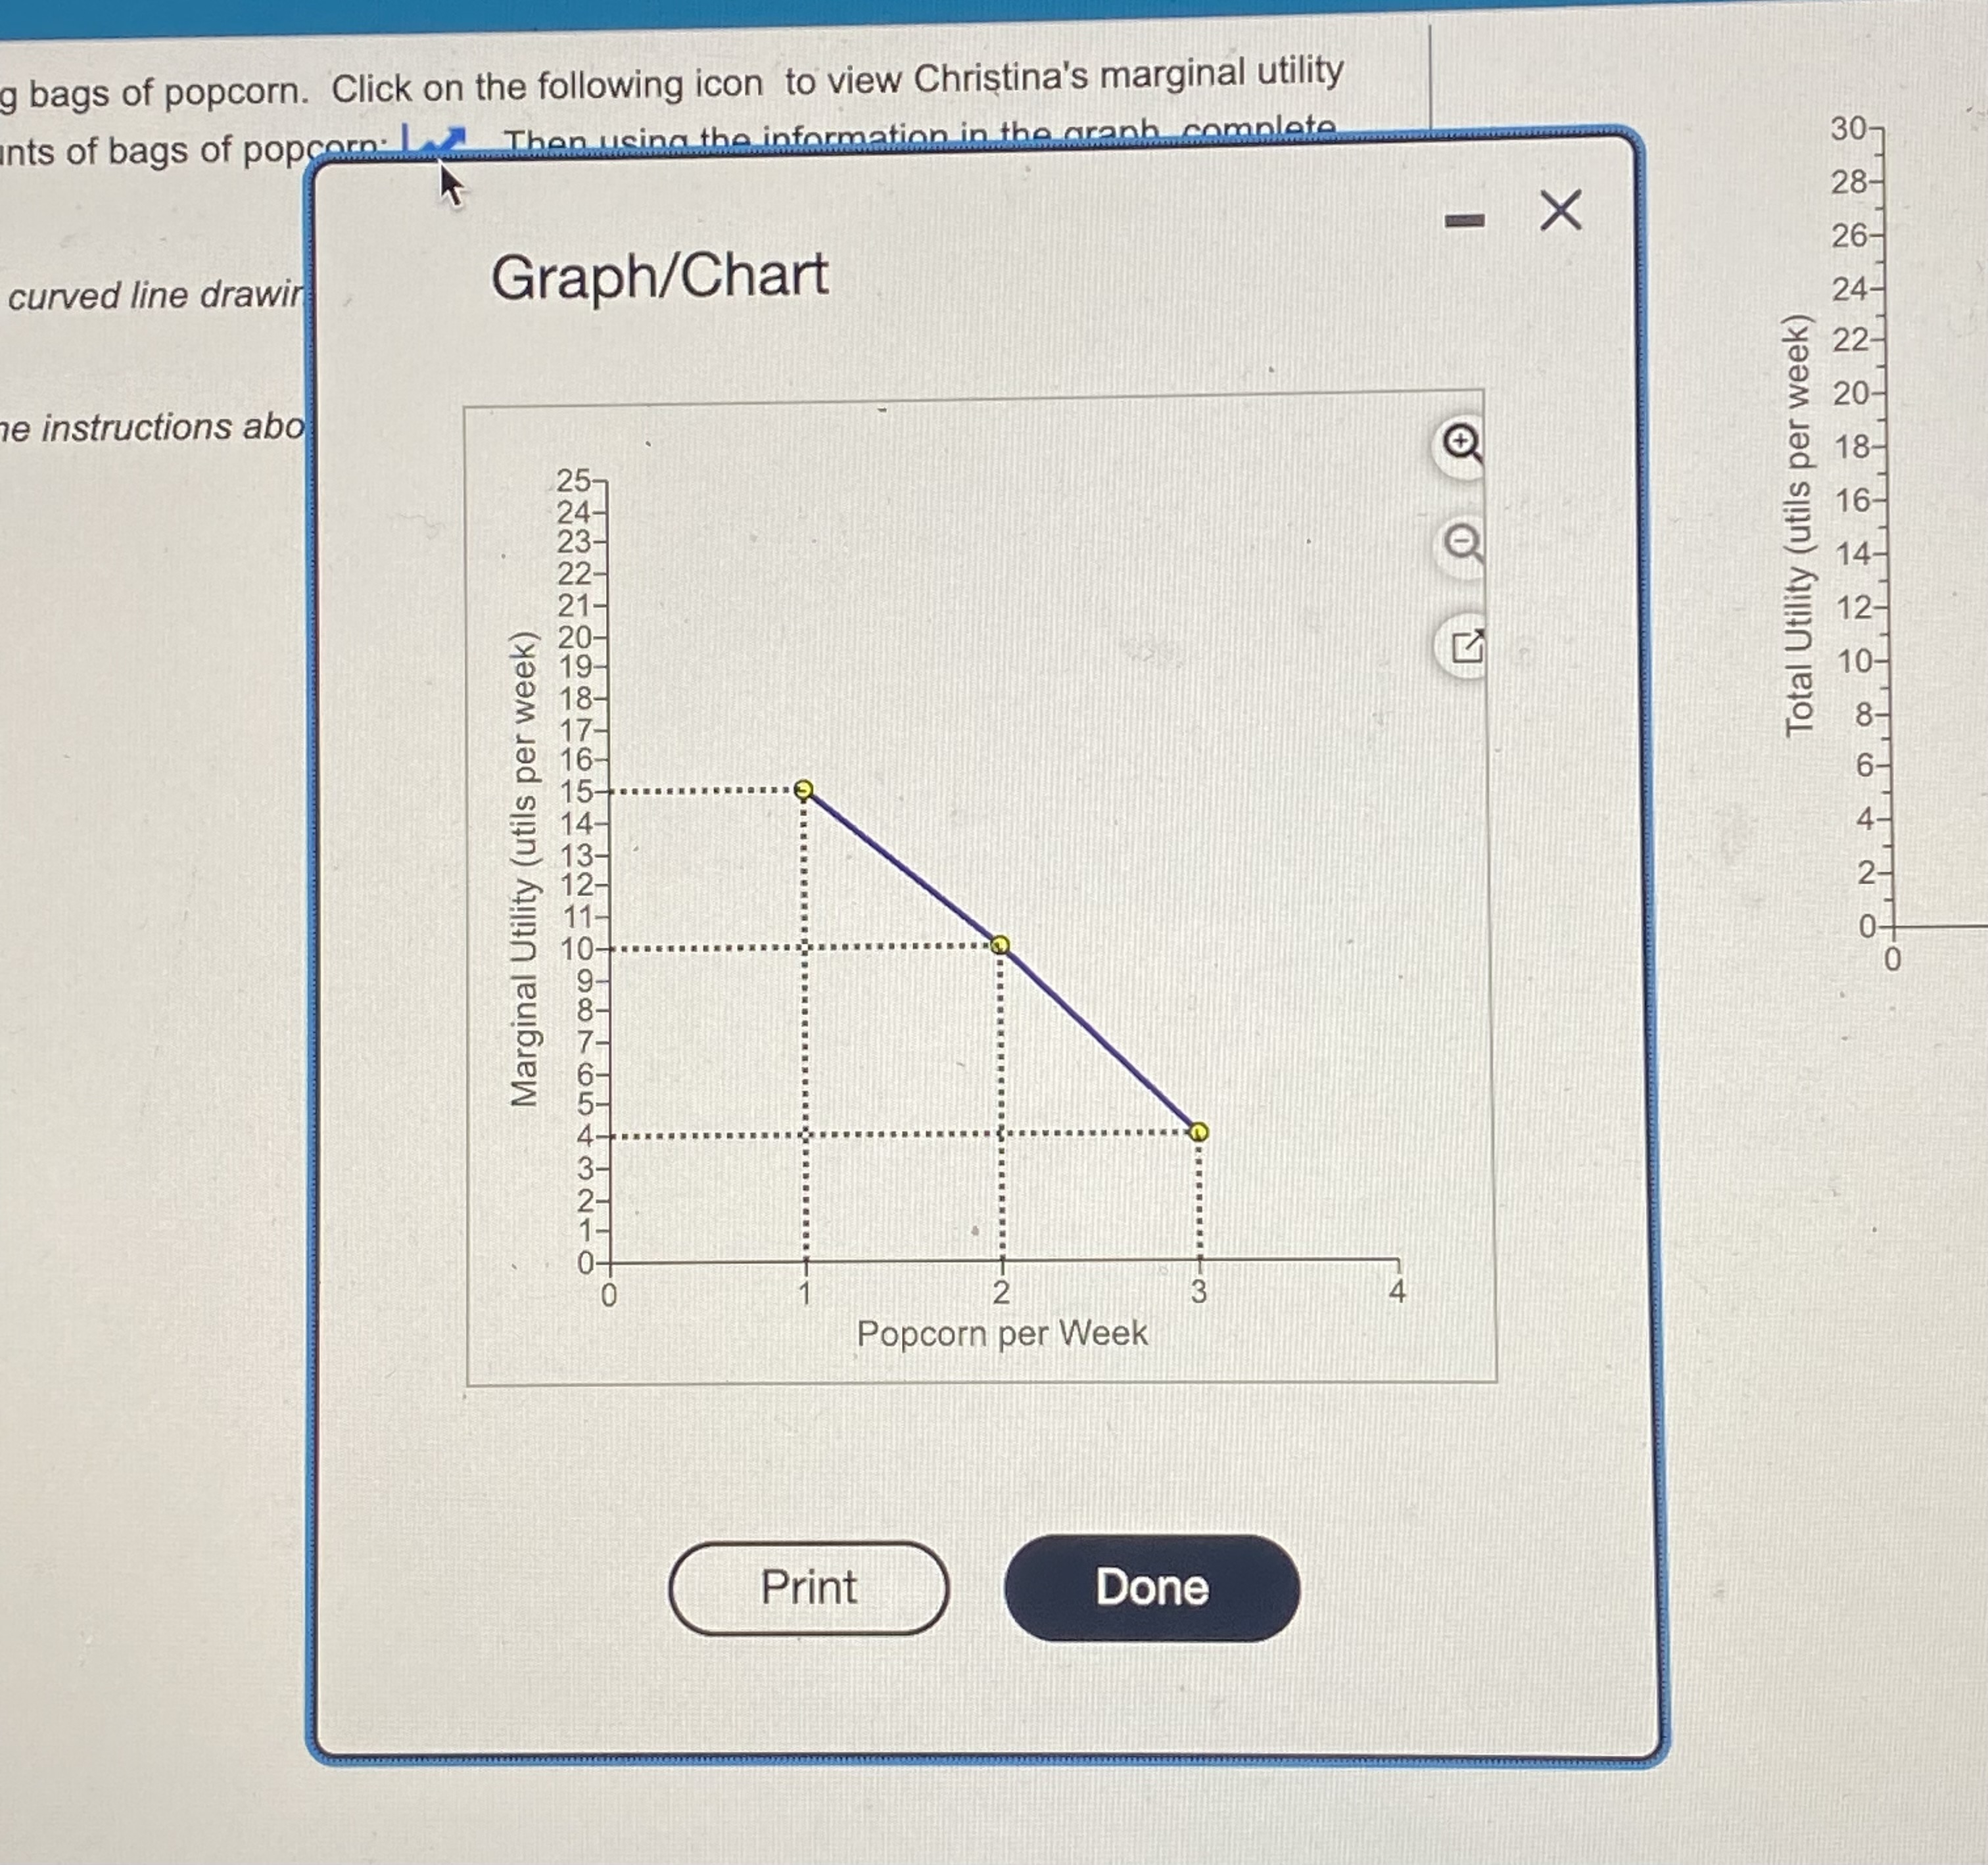
The second picture is information to help plot the graph.
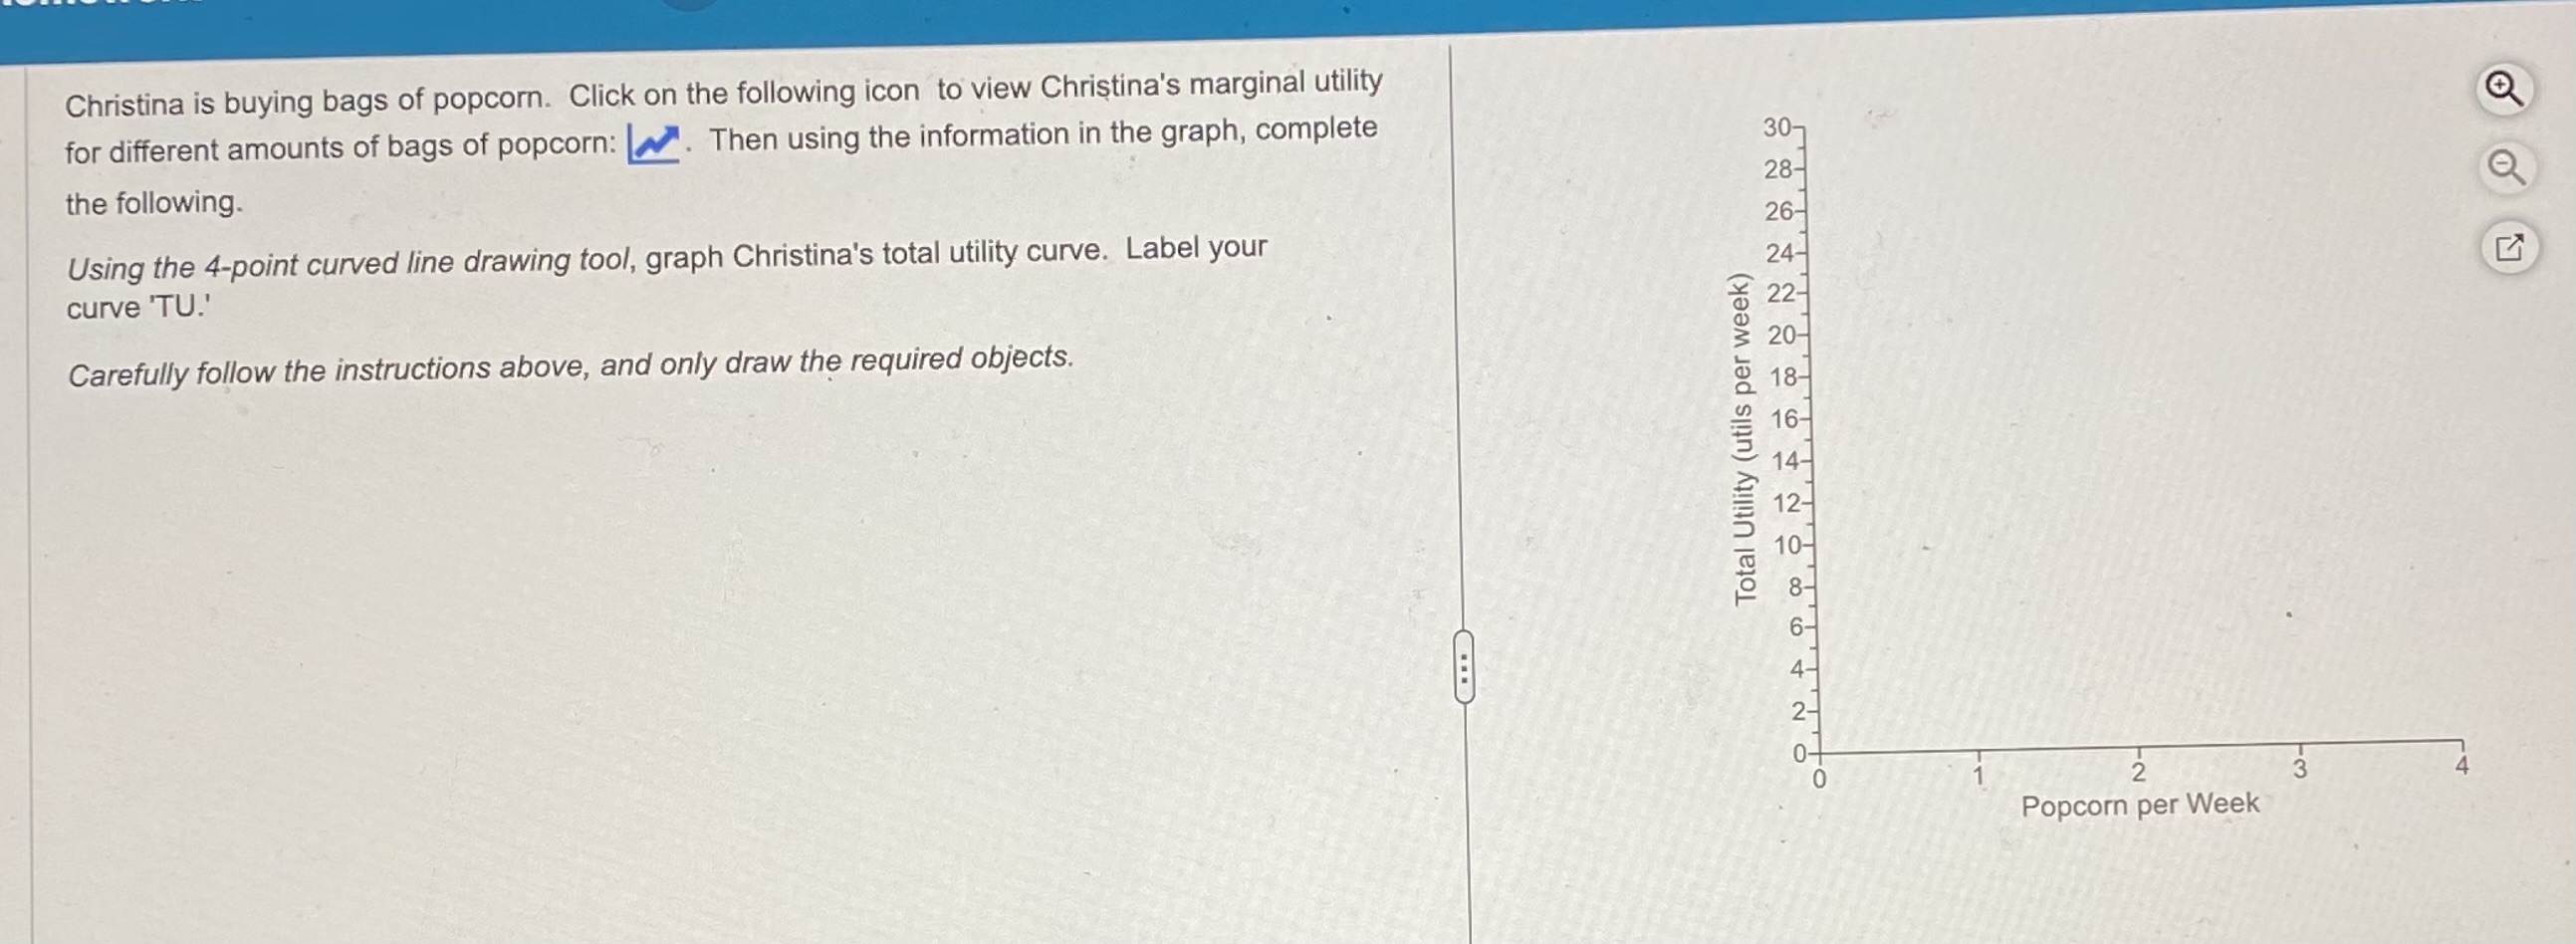
Christina is buying bags of popcorn. Click on the following icon to view Christina's marginal utility Then using the information in the graph, complete for different amounts of bags of popcorn: the following. Using the 4-point curved line drawing tool, graph Christina's total utility curve. Label your curve 'TU.' Carefully follow the instructions above, and only draw the required objects. Total Utility (utils per week) 30] 28- 26- 24- 22- 20- 18- 16- 14- 2- 3 4 0 Popcorn per Week Q
Step by Step Solution
There are 3 Steps involved in it

Get step-by-step solutions from verified subject matter experts