

Question: can someone help me please ourses / Probability and Statistics CP Fall 2020 (Harward) / Unit 3 / Lesson 3.3: Measures of Variability Measures of
can someone help me please
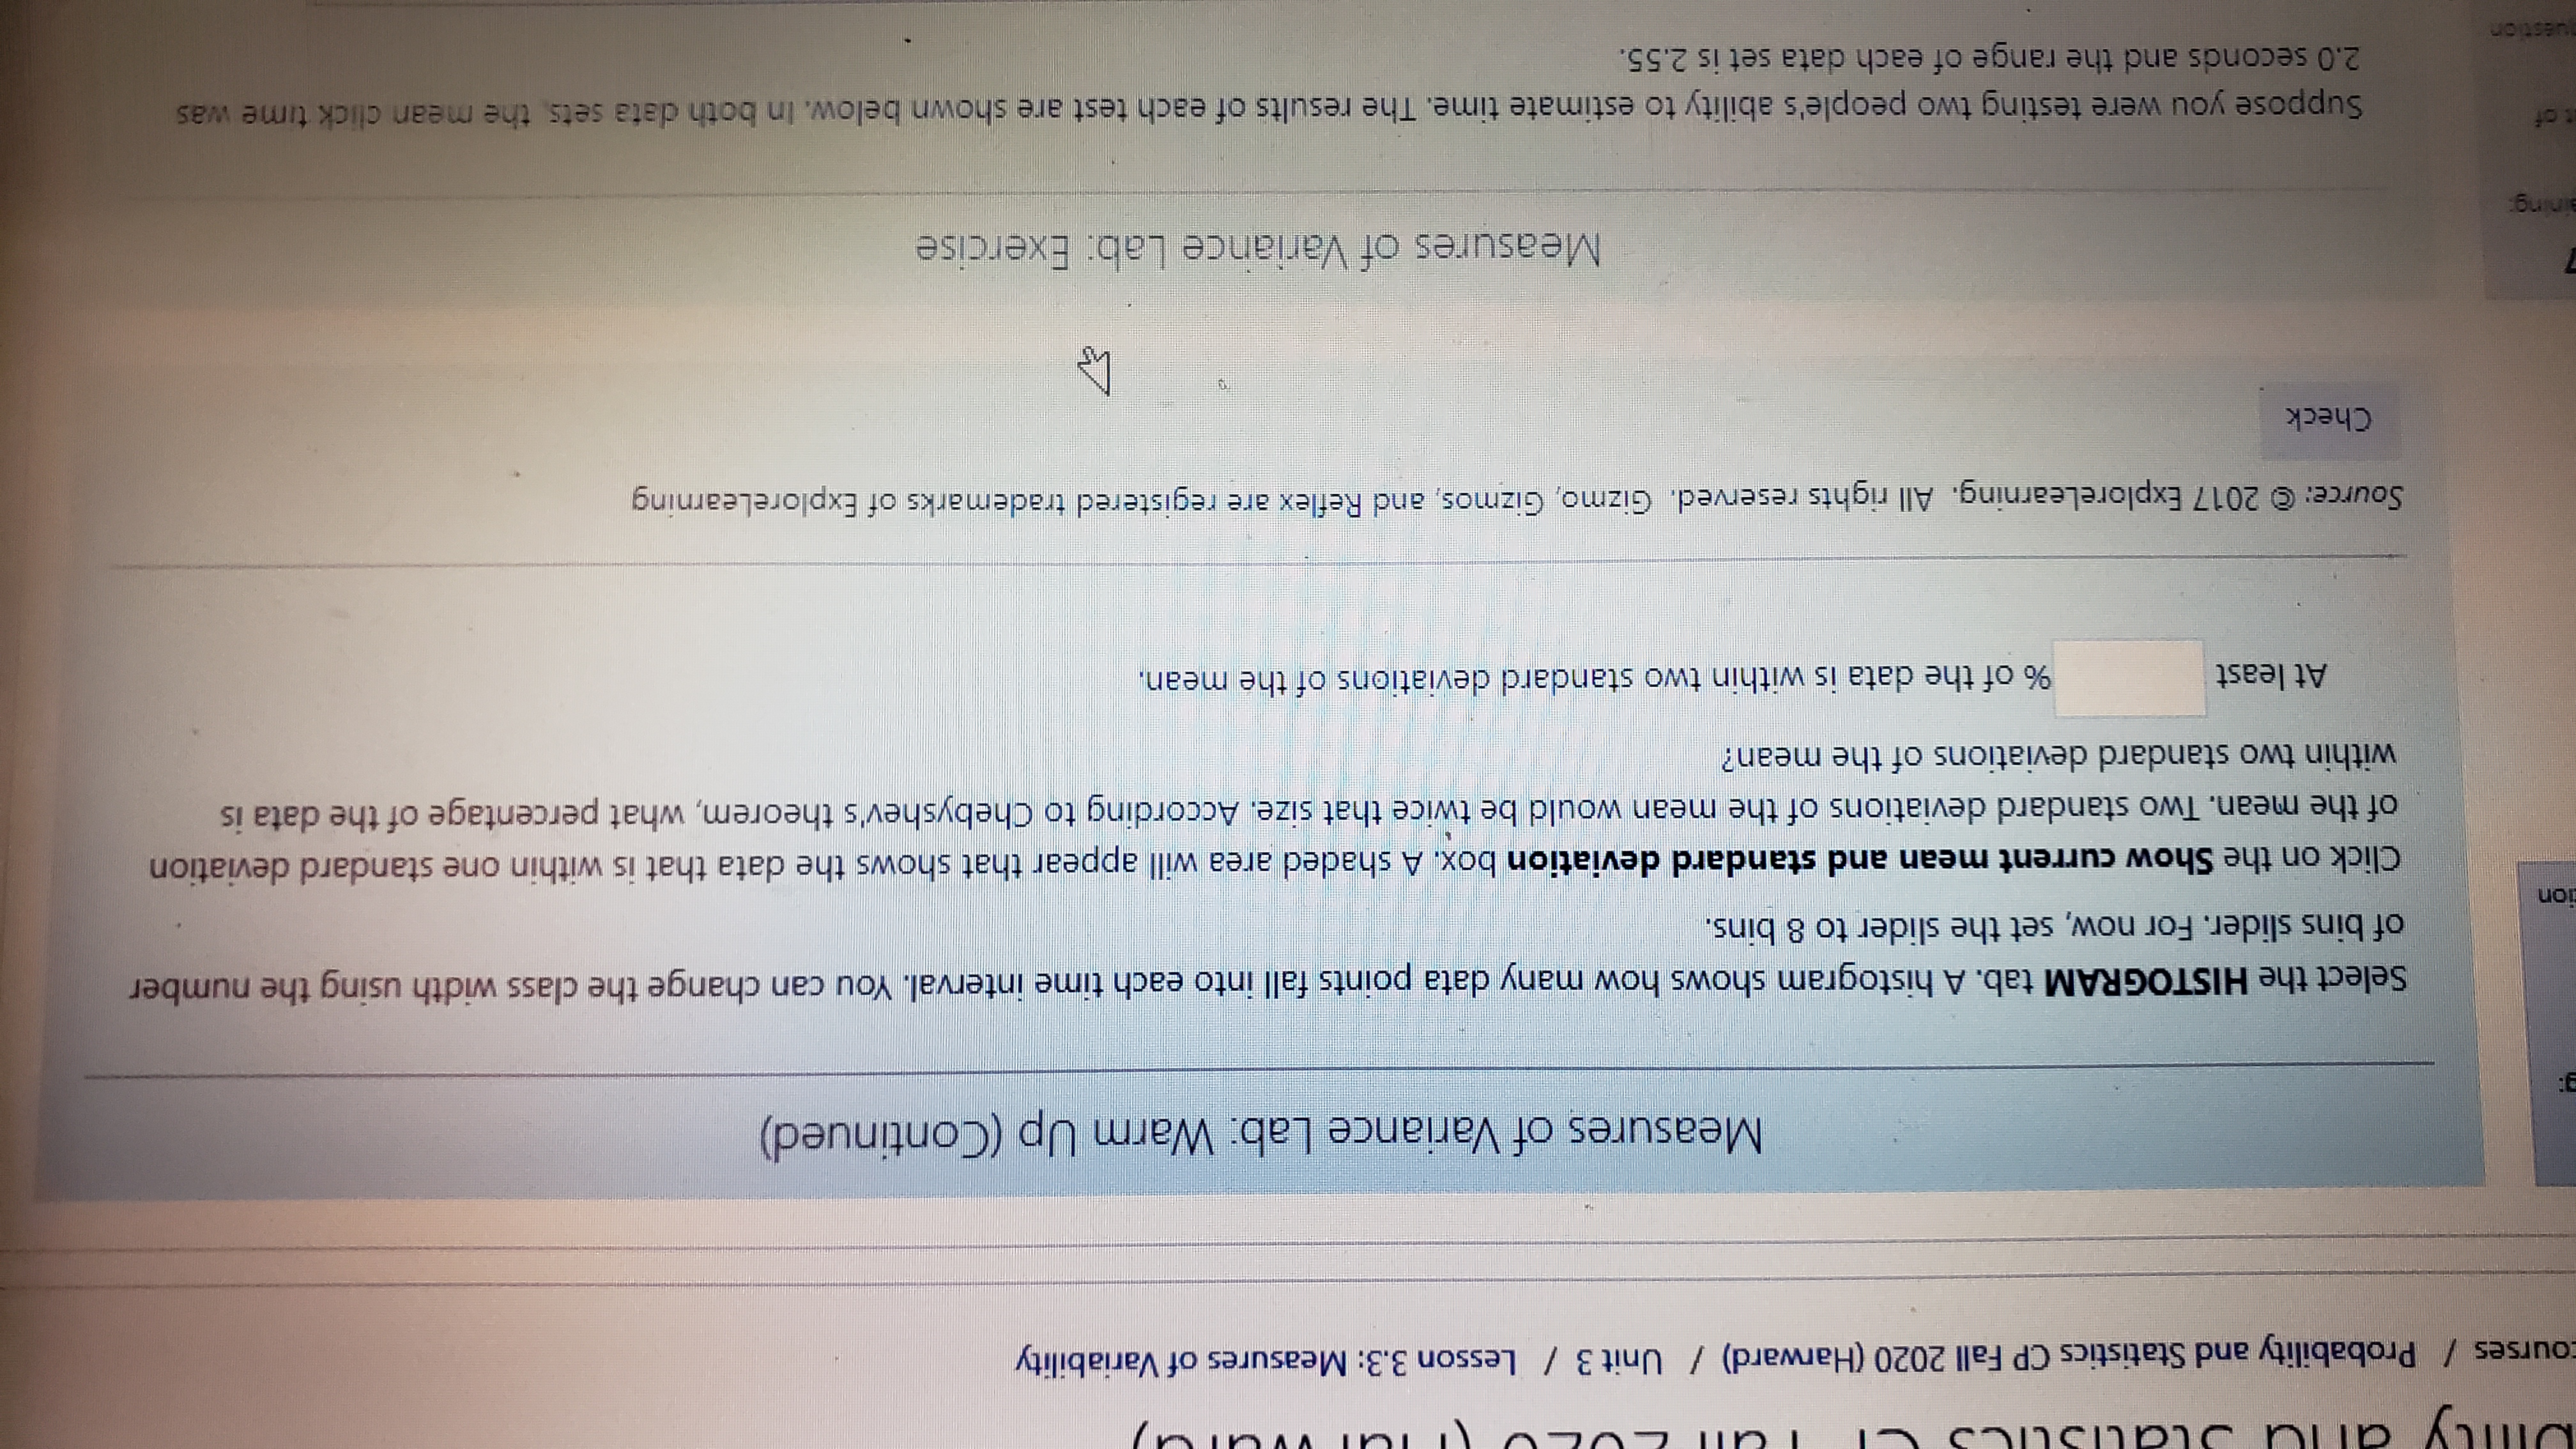
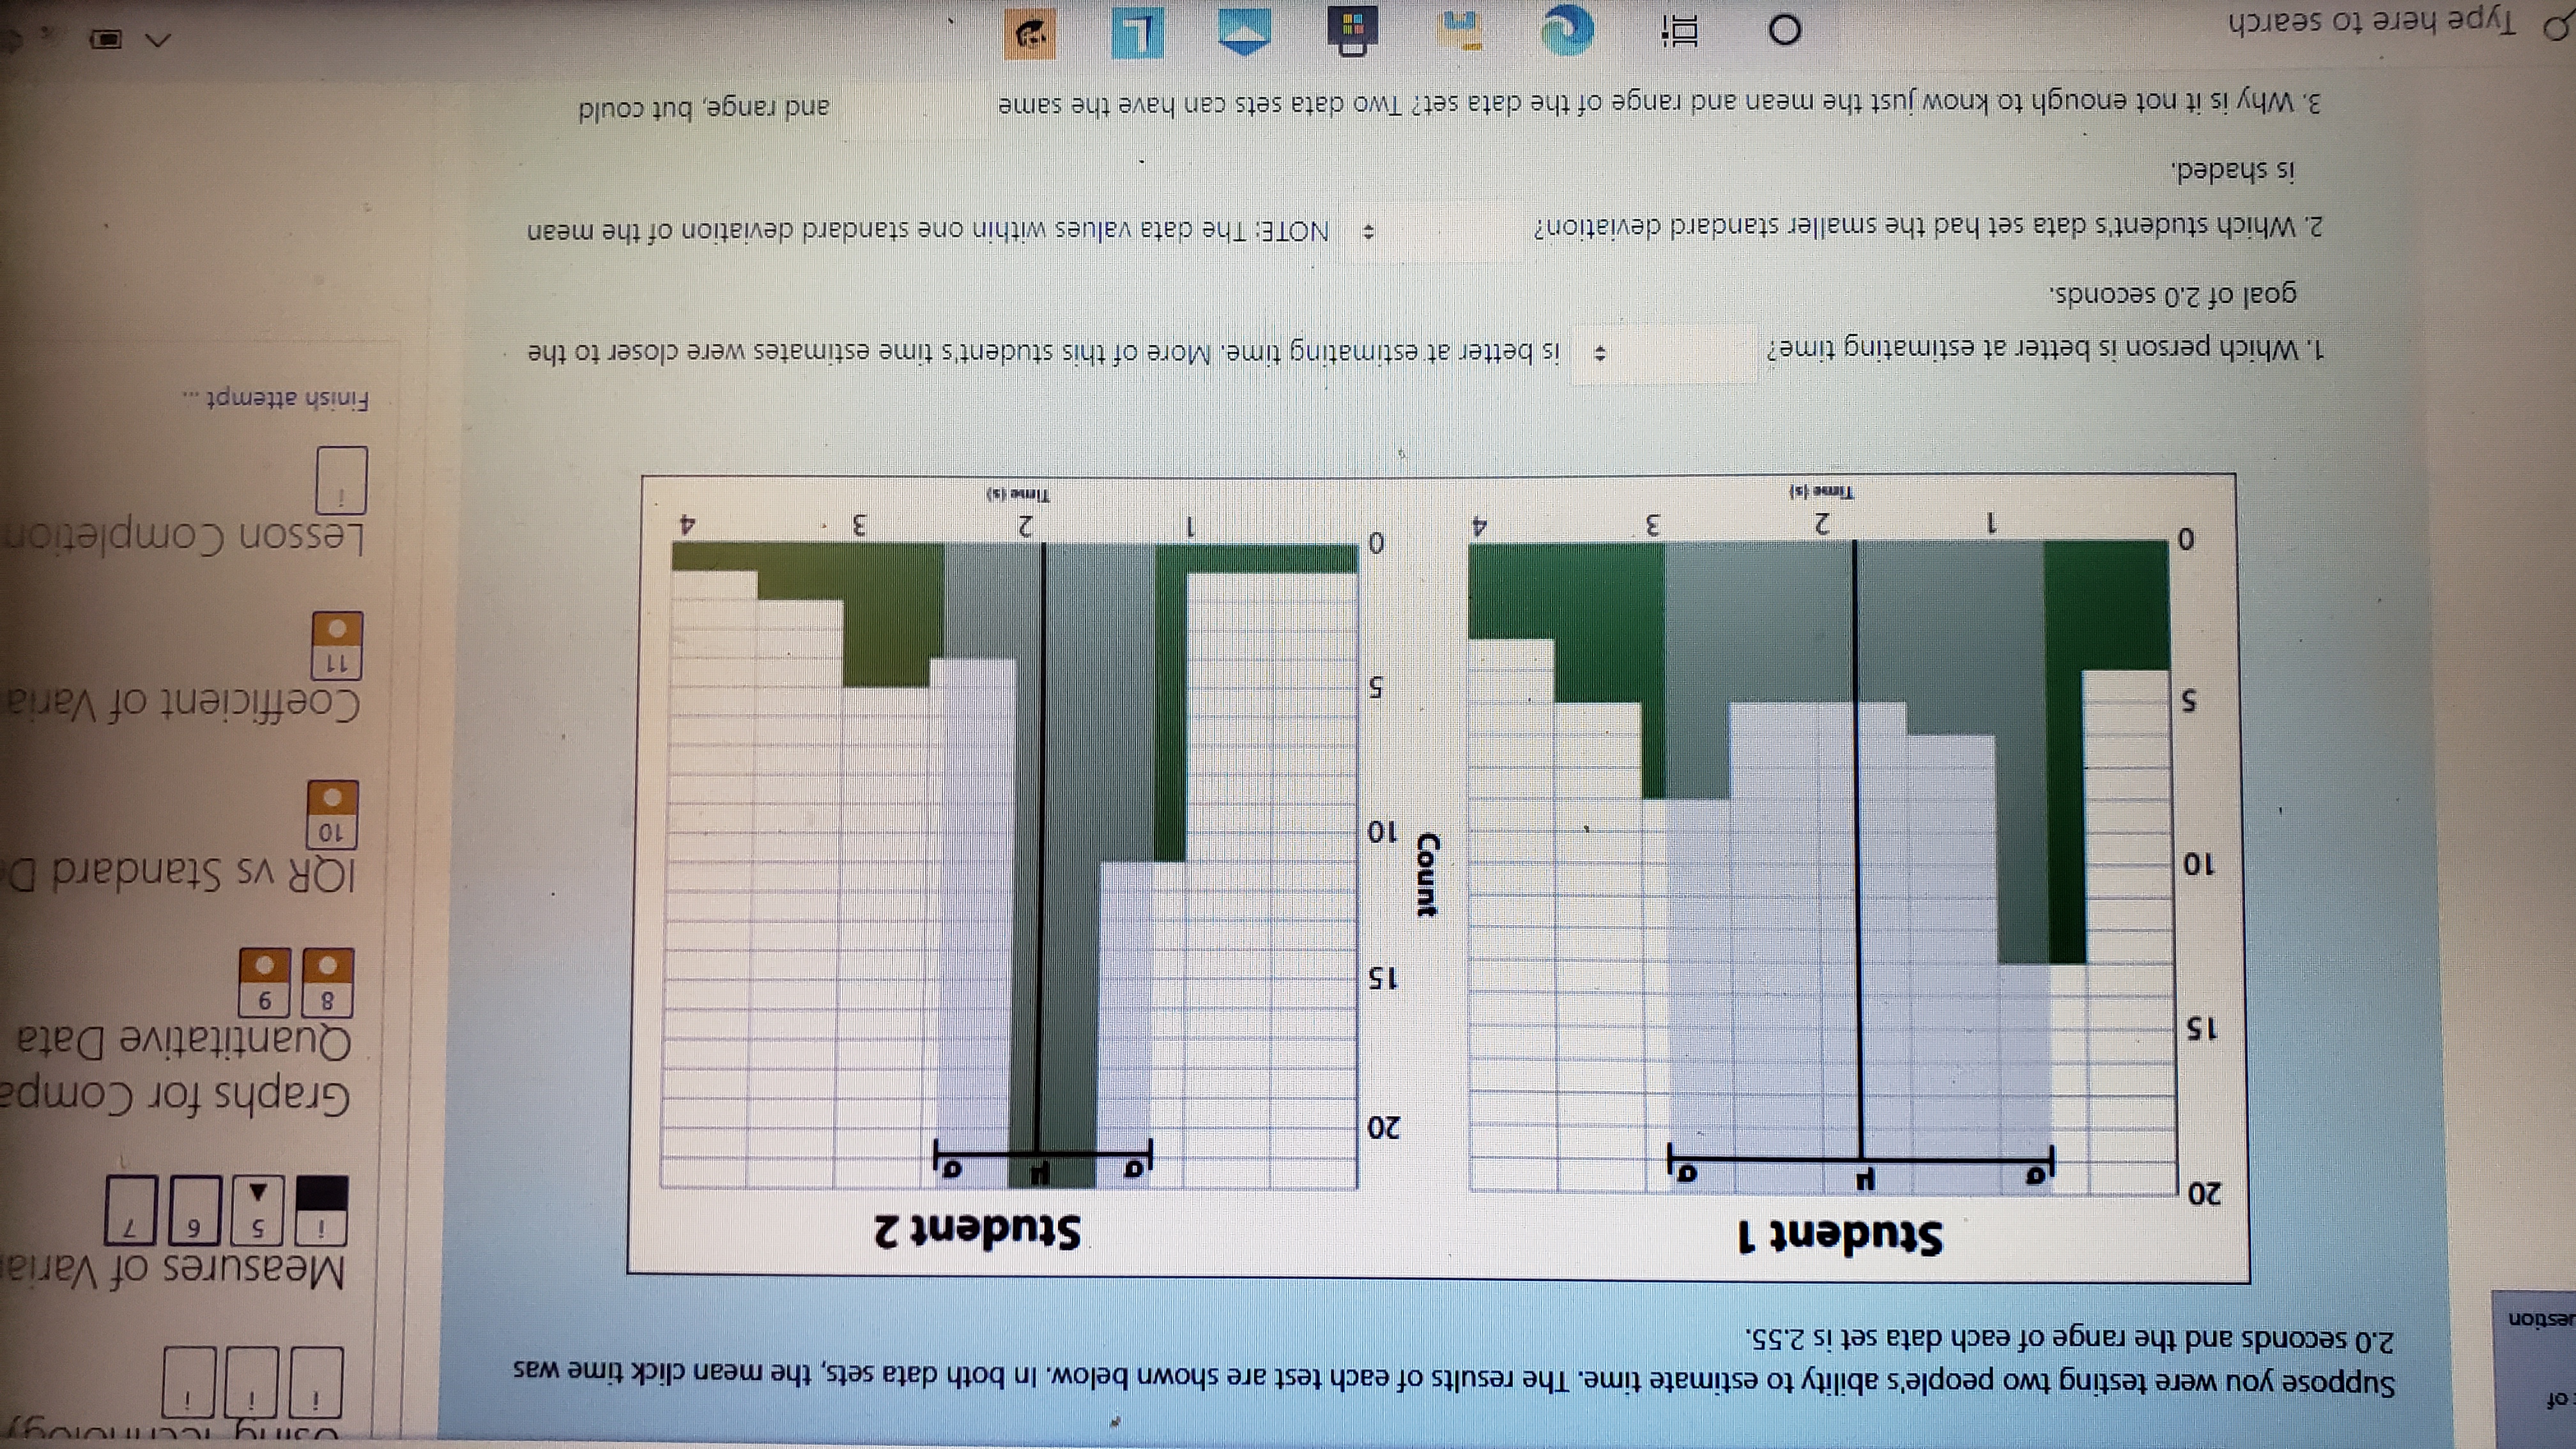
ourses / Probability and Statistics CP Fall 2020 (Harward) / Unit 3 / Lesson 3.3: Measures of Variability Measures of Variance Lab: Warm Up (Continued) Select the HISTOGRAM tab. A histogram shows how many data points fall into each time interval. You can change the class width using the number of bins slider. For now, set the slider to 8 bins. ion Click on the Show current mean and standard deviation box. A shaded area will appear that shows the data that is within one standard deviation of the mean. Two standard deviations of the mean would be twice that size. According to Chebyshev's theorem, what percentage of the data is within two standard deviations of the mean? At least % of the data is within two standard deviations of the mean. Source: @ 2017 ExploreLearning. All rights reserved. Gizmo, Gizmos, and Reflex are registered trademarks of ExploreLearning Check Measures of Variance Lab: Exercise ining of Suppose you were testing two people's ability to estimate time. The results of each test are shown below. In both data sets the mean click time was 2.0 seconds and the range of each data set is 2.55. HestionUJITTY ICULTIVNy of Suppose you were testing two people's ability to estimate time. The results of each test are shown below. In both data sets, the mean click time was 2.0 seconds and the range of each data set is 2.55. bestion Measures of Varia Student 1 Student 2 20 20 Graphs for Compa 15 Quantitative Data 8 15 Count 10 IQR vs Standard D 10 10 . 5 UT Coefficient of Varia 11 . 0 2 3 2 3 Lesson Completion Time Is Time Is> Finish attempt ... 1. Which person is better at estimating time? * is better at estimating time. More of this student's time estimates were closer to the goal of 2.0 seconds. 2. Which student's data set had the smaller standard deviation? # NOTE: The data values within one standard deviation of the mean is shaded. 3. Why is it not enough to know just the mean and range of the data set? Two data sets can have the same and range, but could Type here to search O
Step by Step Solution
There are 3 Steps involved in it

Get step-by-step solutions from verified subject matter experts