

Question: Can someone help me understand this output, do the results occur by chance ? Should the null hypothesis be rejected ? How much of the
Can someone help me understand this output, do the results occur by chance ? Should the null hypothesis be rejected ? How much of the variation is explained from the IVs, are they significant?
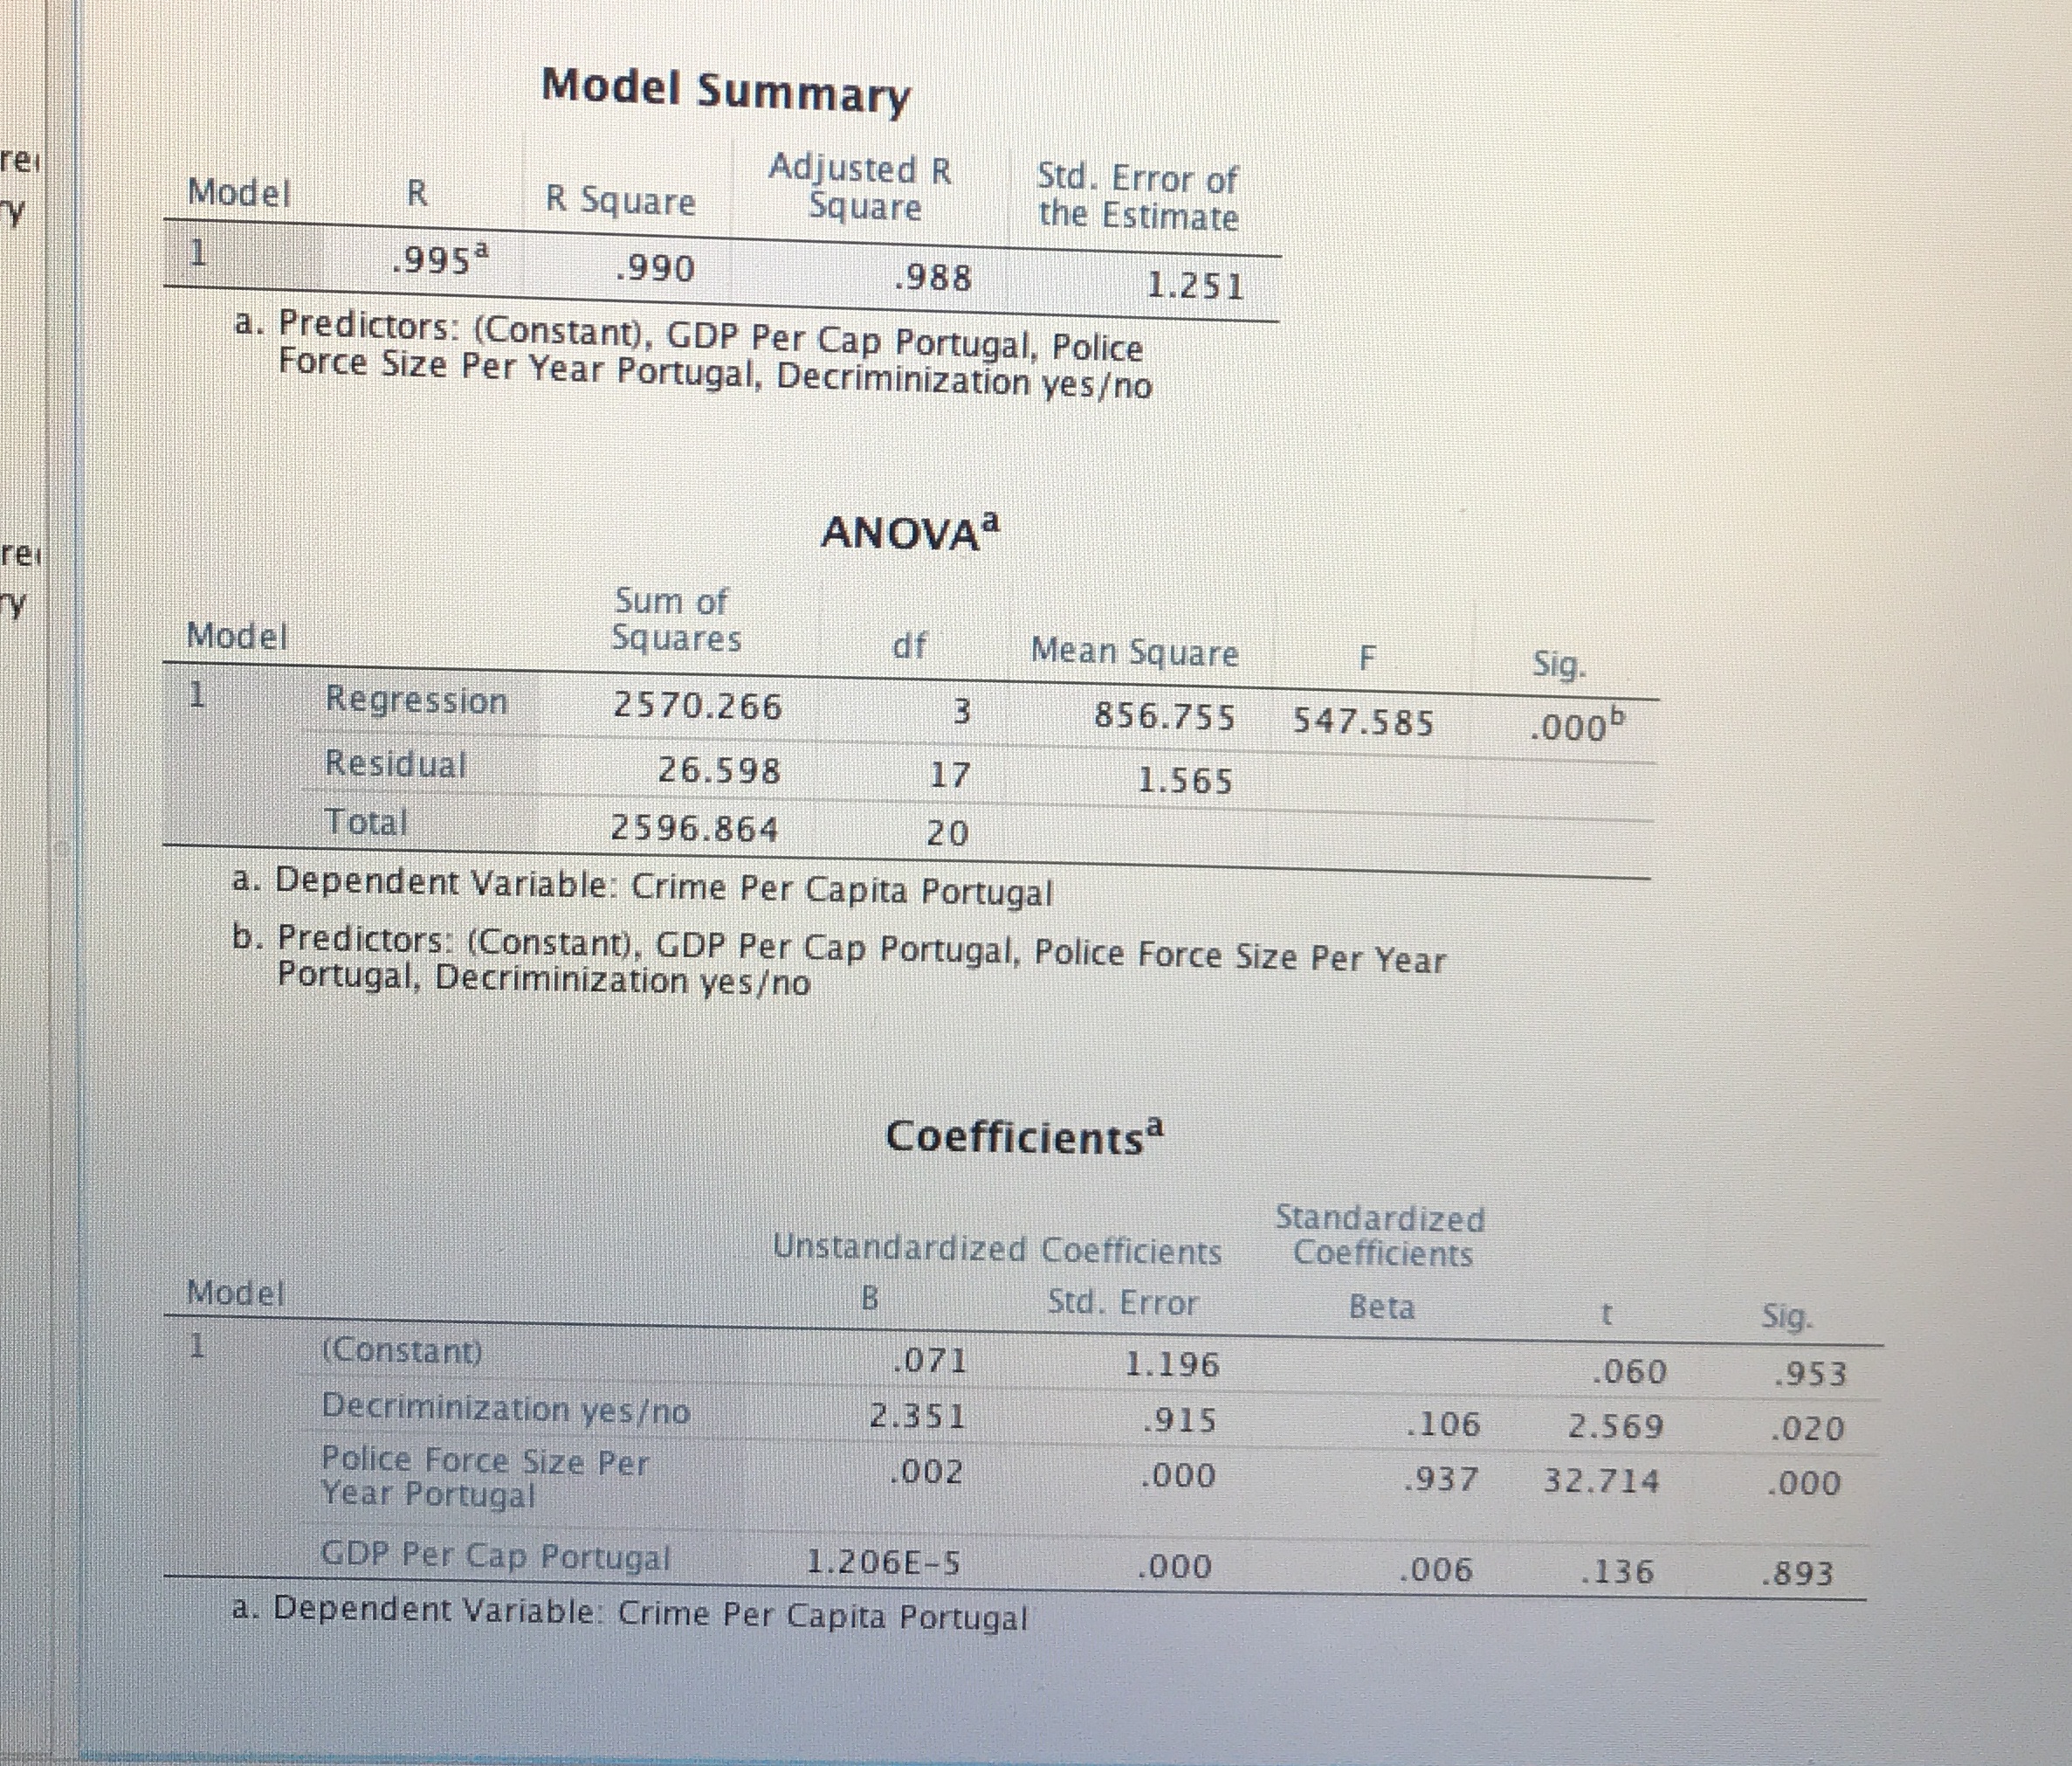
Model Summary Adjusted R Model R R Square Square Std. Error of the Estimate 995 990 988 1.251 a. Predictors: (Constant), GDP Per Cap Portugal, Police Force Size Per Year Portugal, Decriminization yeso ANOVA Sum of Model Squares df Mean Square Sig. Regression 2570.266 3 856.755 547.585 .000 Residual 26.598 17 1.565 Total 2596.864 20 a. Dependent Variable: Crime Per Capita Portugal b. Predictors: (Constant), GDP Per Cap Portugal, Police Force Size Per Year Portugal, Decriminization yeso Coefficients Standardized Unstandardized Coefficients Coefficients Model B Std. Error Beta t Sig. (Constant) .071 1.196 060 953 Decriminization yeso 2.351 915 106 2.569 020 Police Force Size Per 000 32.714 000 Year Portugal .002 1937 GDP Per Cap Portugal 1.206E-5 000 006 136 893 a. Dependent Variable: Crime Per Capita Portugal
Step by Step Solution
There are 3 Steps involved in it

Get step-by-step solutions from verified subject matter experts