

Question: Can someone please help me understand the output, do the results occur by chance ? Should the null hypothesis be rejected ? How much of
Can someone please help me understand the output, do the results occur by chance ? Should the null hypothesis be rejected ? How much of the variation is explained by the IVs, are they significant ?
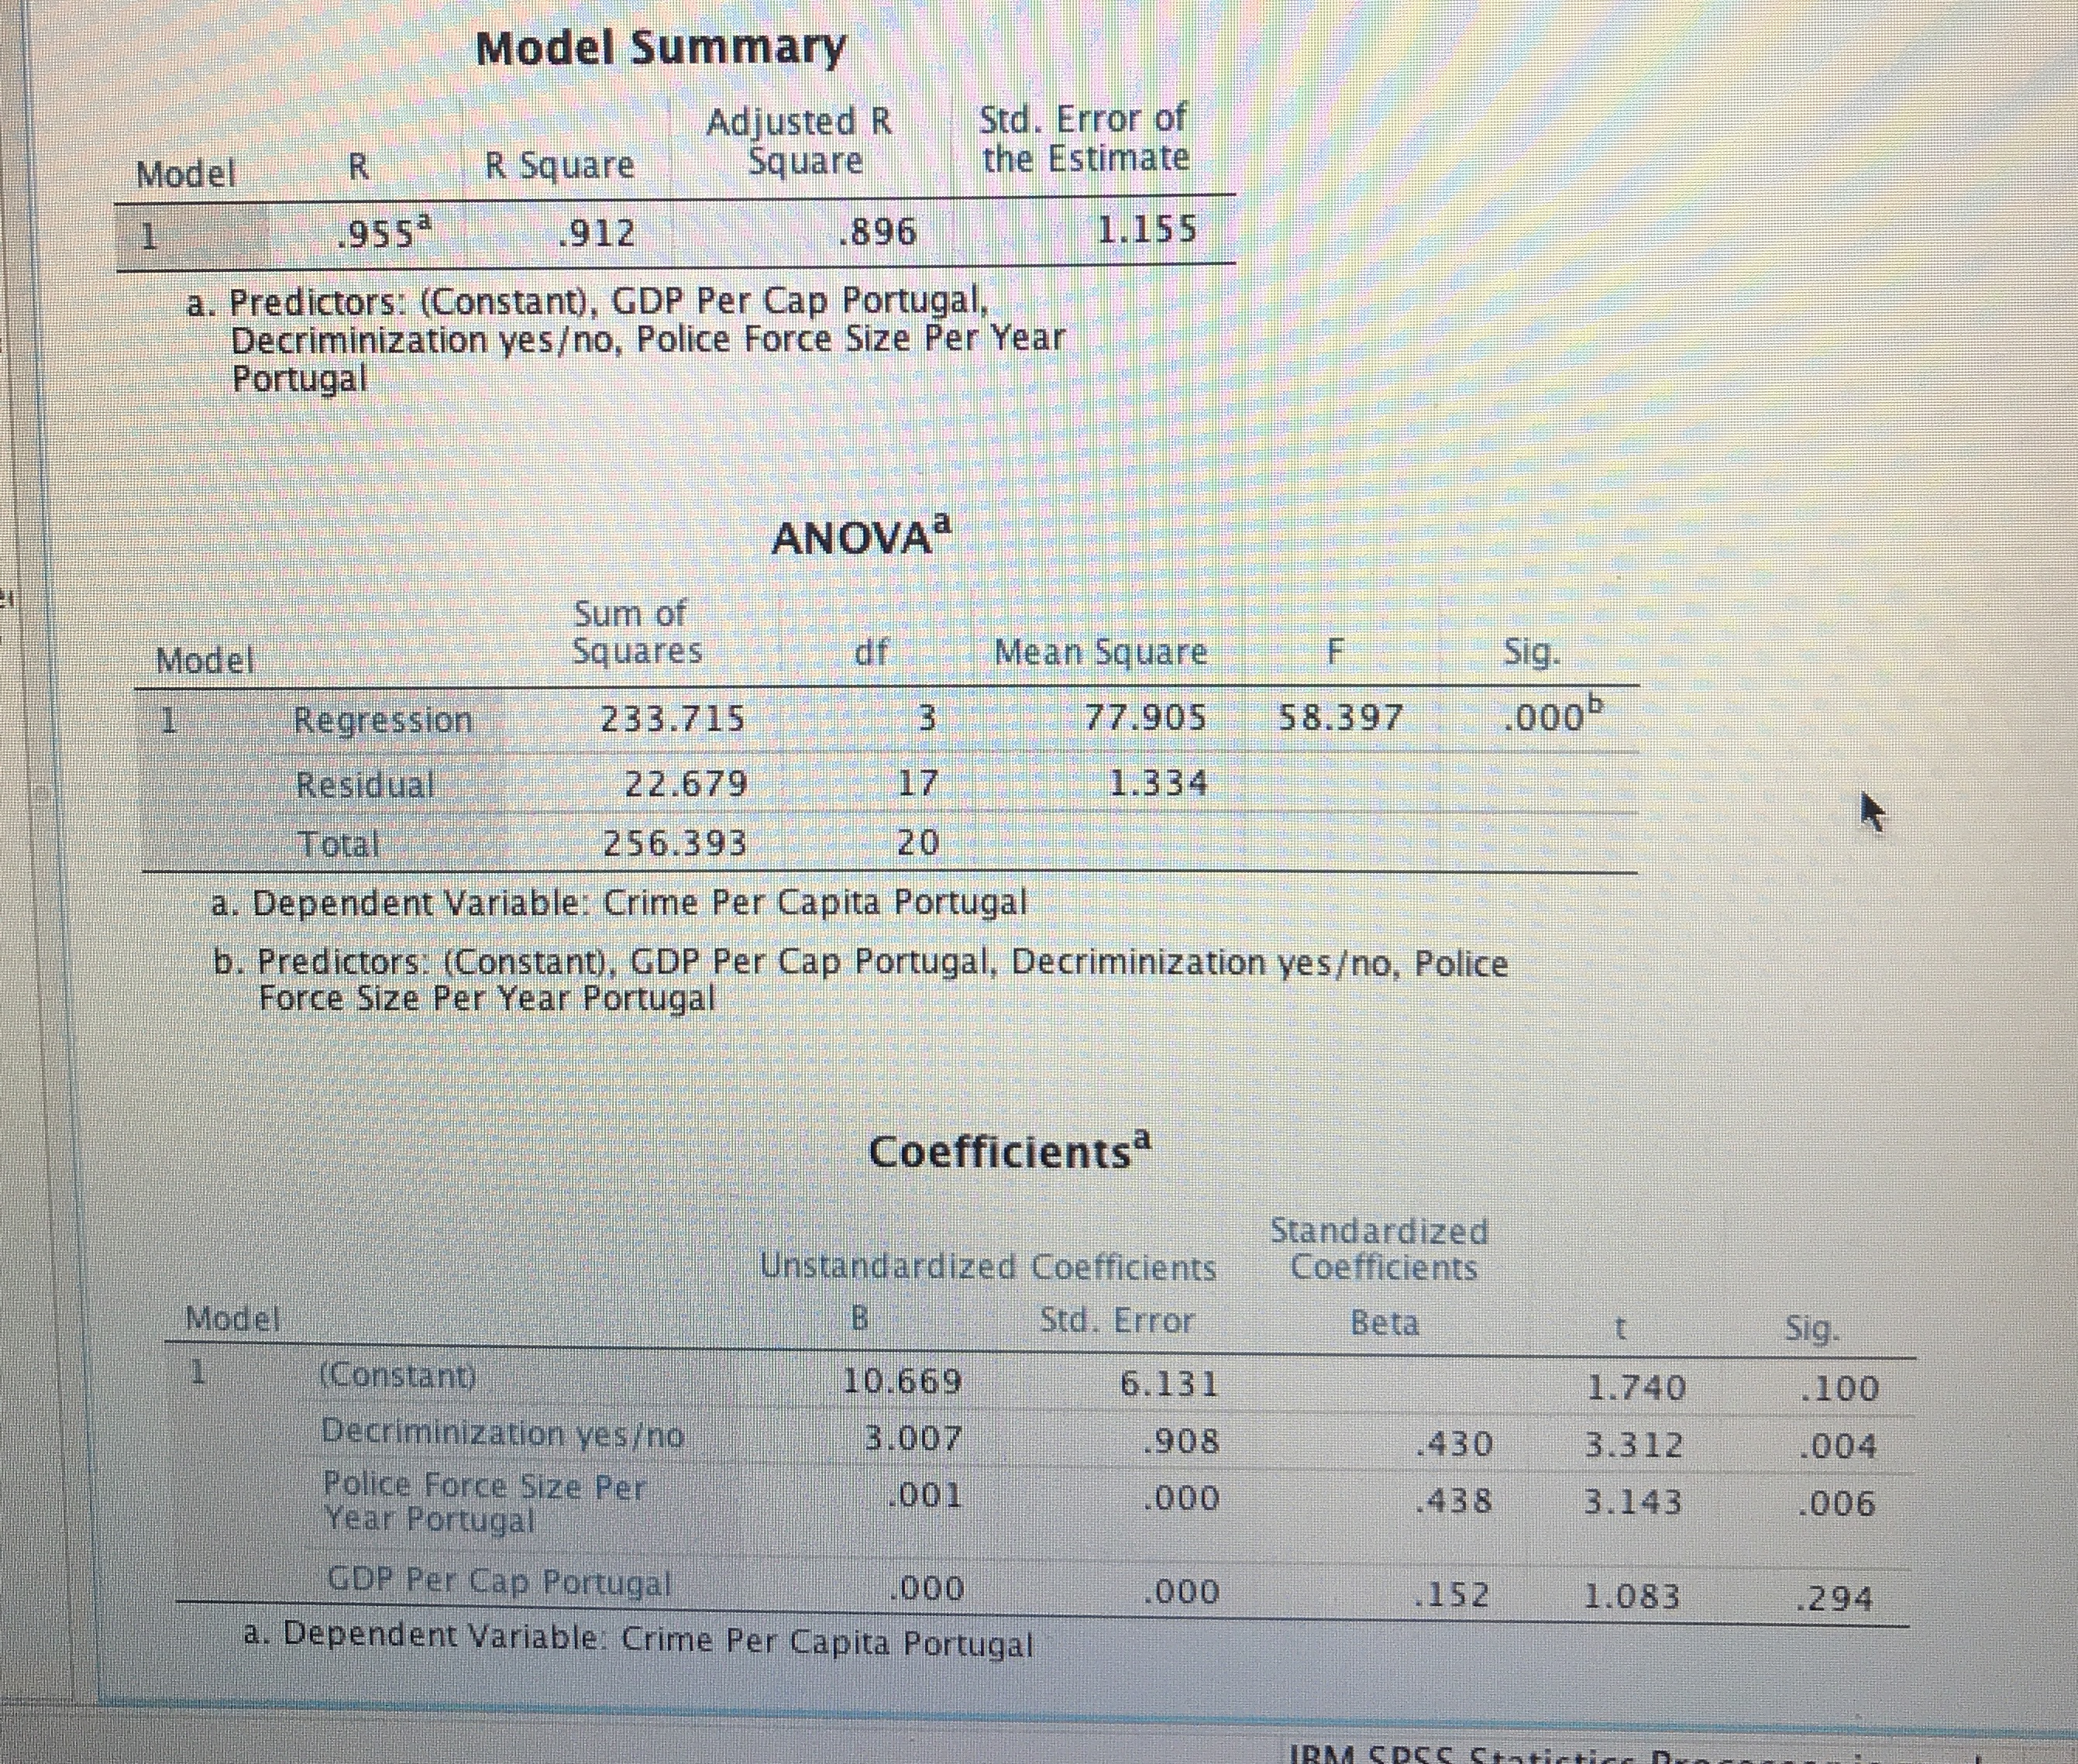
Model Summary Adjusted R Std. Error of Model R R Square Square the Estimate .9553 .912 .896 1.155 a. Predictors: (Constant), GDP Per Cap Portugal, Decriminization yeso, Police Force Size Per Year Portugal ANOVA" Sum of Model Squares df Mean Square Sig. Regression 233.715 77.905 58.397 000 Residual 22.679 17 1.334 Total 256.393 20 a. Dependent Variable: Crime Per Capita Portugal b. Predictors: (Constant), GDP Per Cap Portugal, Decriminization yeso, Police Force Size Per Year Portugal Coefficients Standardized Unstandardized Coefficients Coefficients Model Std. Error Beta Sig. Constant) 10.669 6.131 1.740 .100 Decriminization yes/ no 3.007 908 430 3.312 004 Police Force Size Per Year Portugal 001 000 438 3.143 006 GDP Per Cap Portugal 000 000 152 1.083 1294 a. Dependent Variable: Crime Per Capita Portugal
Step by Step Solution
There are 3 Steps involved in it

Get step-by-step solutions from verified subject matter experts