

Question: can someone help me with the graphing because it's really confusing c) Plot each per capita cost function on a two yaxis graph (as in
can someone help me with the graphing because it's really confusing

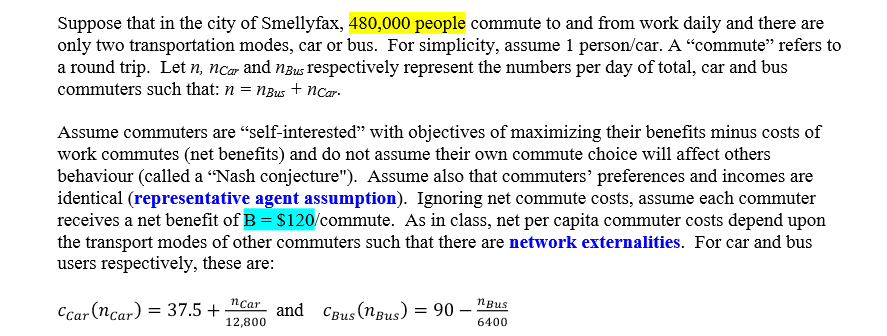
c) Plot each per capita cost function on a two yaxis graph (as in class) and label it Fig. 1 such that the x axis represents the number of commuters of each type with the number of bus riders increasing from left to right and the opposite for cars. d) In a Nash equilibrium, no commuter has incentives to unilaterally change his or her strategy. Find the 3 Nash equilibria in the model and label on your graph. u J. e) Draw phase diagram arrows on your graphto indicate how the number of bus and car commuters is expected to change in each region of the graph. Label the critical. mass allocation. f) Indicate whether each of the equilibria is stable and provide a brief explanation. k) Covid 19 affects the relative safety of public transport because it is difficult for people to physically distance themselves. Redraw the graph and label it Fig. 2 and provide a hypothesis as to how COVID might affect the curves in the graph and the critical mass equilibrium and illustrate this on the graph (ex. shifts of curves). Provide a careful explanation [about 1/3 of a page of medium size hand writing].Suppose that in the city of Smellyfax, 480,000 people commute to and horn work daily and there are only two transportation modes, car or bus. For simplicity, assume 1 personfcar. A \"commute\" refers to a round trip. Let :1, new. and :13,\" respectively represent the numbers per day of total, car and bus commuters such that: n = r13\
Step by Step Solution
There are 3 Steps involved in it

Get step-by-step solutions from verified subject matter experts