

Question: Can someone help me with this Problem 10.16 Consider a study comparing two medications for severe bladder infections. The variable r is the length of
Can someone help me with this
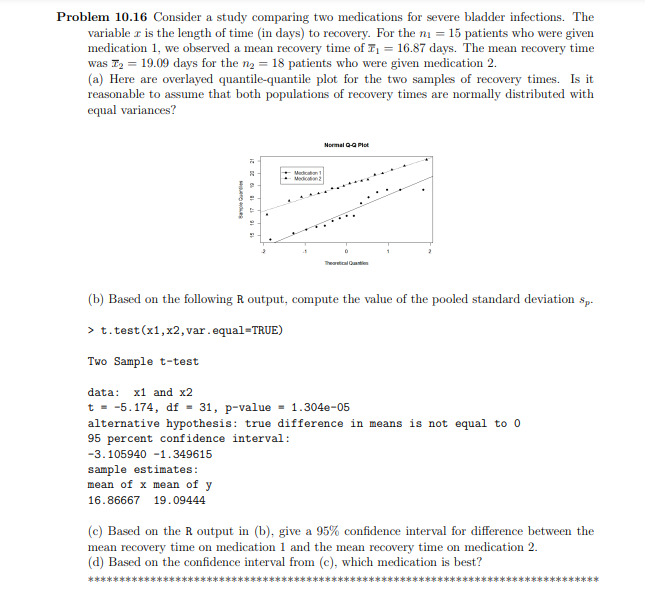
Problem 10.16 Consider a study comparing two medications for severe bladder infections. The variable r is the length of time (in days) to recovery. For the m = 15 patients who were given medication 1, we observed a mean recovery time of F1 = 16.87 days. The mean recovery time was 72 = 19.09 days for the ne = 18 patients who were given medication 2. (a) Here are overlayed quantile-quantile plot for the two samples of recovery times. Is it reasonable to assume that both populations of recovery times are normally distributed with equal variances? Normal Q-Q Plot 11 4 3 7 19 18 17 (b) Based on the following R output, compute the value of the pooled standard deviation s,- > t. test (x1, x2, var . equal=TRUE) Two Sample t-test data: x1 and x2 t = -5. 174, df = 31, p-value = 1.304e-05 alternative hypothesis: true difference in means is not equal to 0 95 percent confidence interval: -3. 105940 -1.349615 sample estimates: mean of x mean of y 16.86667 19. 09444 (c) Based on the R output in (b), give a 95% confidence interval for difference between the mean recovery time on medication 1 and the mean recovery time on medication 2. (d) Based on the confidence interval from (c), which medication is best
Step by Step Solution
There are 3 Steps involved in it

Get step-by-step solutions from verified subject matter experts