

Question: Can you please help me out with the second question near the bottom of the first screen shot? Thank you for all of your hard
Can you please help me out with the second question near the bottom of the first screen shot? Thank you for all of your hard work and effort.
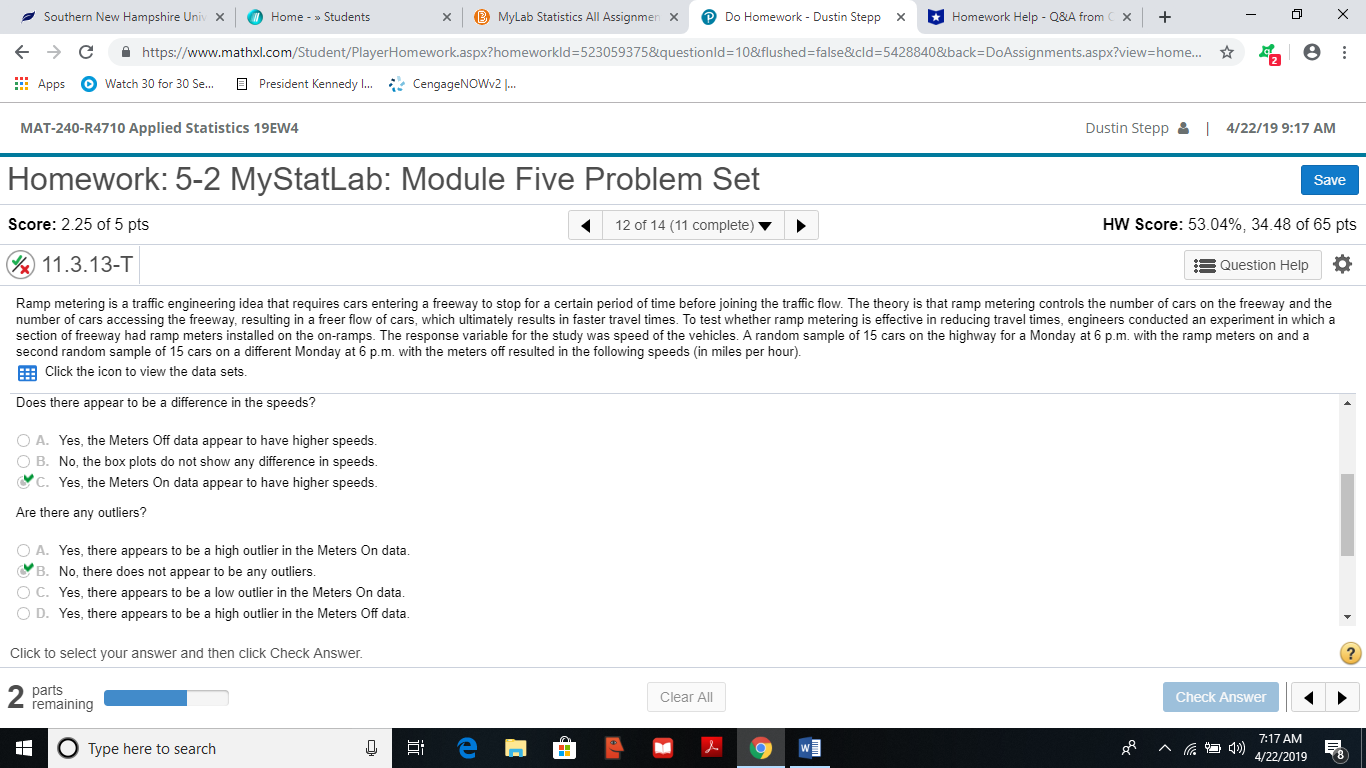
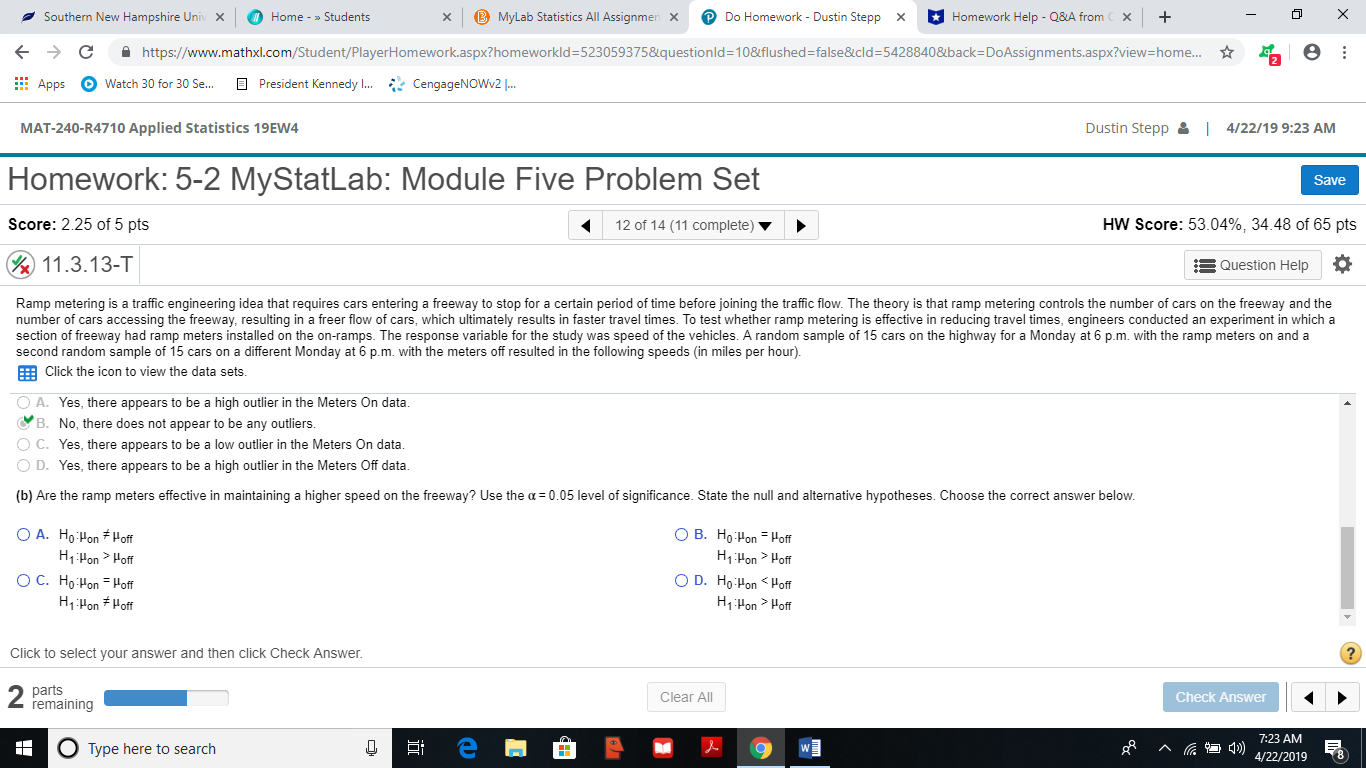
Southern New Hampshire Univ x Home - >> Students X MyLab Statistics All Assignmen X Do Homework - Dustin Stepp X * Homework Help - Q&A from ( x + X https://www.mathxl.com/Student/PlayerHomework.aspx?homeworkld=523059375&questionld=10&flushed=false&cld=5428840&back=DoAssignments.aspx?view=home... : Apps O Watch 30 for 30 Se.. President Kennedy I... . CengageNOWv2 |... MAT-240-R4710 Applied Statistics 19EW4 Dustin Stepp & | 4/22/19 9:17 AM Homework: 5-2 MyStatLab: Module Five Problem Set Save Score: 2.25 of 5 pts 12 of 14 (11 complete) HW Score: 53.04%, 34.48 of 65 pts 11.3.13-T Question Help Ramp metering is a traffic engineering idea that requires cars entering a freeway to stop for a certain period of time before joining the traffic flow. The theory is that ramp metering controls the number of cars on the freeway and the number of cars accessing the freeway, resulting in a freer flow of cars, which ultimately results in faster travel times. To test whether ramp metering is effective in reducing travel times, engineers conducted an experiment in which a section of freeway had ramp meters installed on the on-ramps. The response variable for the study was speed of the vehicles. A random sample of 15 cars on the highway for a Monday at 6 p.m. with the ramp meters on and a second random sample of 15 cars on a different Monday at 6 p.m. with the meters off resulted in the following speeds (in miles per hour). Click the icon to view the data sets. Does there appear to be a difference in the speeds? O A. Yes, the Meters Off data appear to have higher speeds O B. No, the box plots do not show any difference in speeds C. Yes, the Meters On data appear to have higher speeds. Are there any outliers? O A. Yes, there appears to be a high outlier in the Meters On data. B. No, there does not appear to be any outliers. O C. Yes, there appears to be a low outlier in the Meters On data O D. Yes, there appears to be a high outlier in the Meters Off data. Click to select your answer and then click Check Answer. ? 2 parts remaining Clear All Check Answer O Type here to search 0 Ei emo Q W A 7:17 AM 4/22/2019~` Southern New Hampshire Univ X| Home - * Students* X| } MyLab Statistics All Assignmen X| @ Do Homework - Dustin Stepp X Homework Help - QOLA from [ X|\\ + https: / / www . math*l .com / Student / Player Homework aspx ? homeworkId = 523:0593.75 &Lquestioned = 10.&Lflushed = false Becld = 5428.840 8xback = Do Assignments. aspx ? View = home . { *` Apps @ Watch 30 for 30 5 8 .\\ President Kennedy ! ...*` Cengage NOW/ V Z J . MAT - 240 - R 4710 Applied Statistics 19 EW/ 4\\ Dustin Stepp = 1 4/22 / 19 9:23 AM) Homework : 5 - 2 MY StatLab : Module Five Problem Set Score : 2.25 Of 5 pts 1 / 12 Of 14 ( 1 1 complete ) ~| } HW Score : 53. 04%/6, 34.48 of 65 pts ( x) 11.3.13 - 7) * = Question Help Ramp metering is a traffic engineering idea that requires cars entering a freeway to stop for a certain period of time before joining the traffic flow . The theory is that ramp metering controls the number of cars on the freeway and the number of cars accessing the freeway , resulting in a freer flow of cars , which ultimately results in faster travel times . To test whether ramp metering is effective in reducing travel times , engineers conducted an experiment in which a section of freeway had ramp meters installed on the on-ramps . The response variable for the study was speed of the vehicles . A random sample of 15 cars on the highway for a Monday at 6 p.m. with the ramp meters on and a second random sample of 15 cars on a different Monday at 6 p . m . with the meters off resulted in the following speeds ( in miles per hour ) . Click the icon to view the data sets . O A. 'Yes , there appears to be a high outlier in the Meters On data . ` B . No , there does not appear to be any outliers . OC . Yes , there appears to be a low outlier in the Meters On data* O D.'Yes , there appears to be a high outlier in the Meters Off data* ( 6 ) Are the ramp meters effective in maintaining a higher speed on the freeway ? Use the * = 0.05 level of significance . State the null and alternative hypotheses . Choose the correct answer below . O A . HO : Hon * Hoff\\ OB . HO: Hon = Hoff Hq : Hon* Hoff Hq : Hon* Hoff OC. HO : Hon = Hoff\\ OD. HO : Hon* Hoff Hy : Hon* Hoff Hy : Hon = Hoff Click to select your answer and then click Check Answer* ` parts remaining Clear All D O Type here to search {` |0 ) WE THE`ANU
Step by Step Solution
There are 3 Steps involved in it

Get step-by-step solutions from verified subject matter experts