

Question: Can someone help me with this question: instructions: 1. Do Tables -> Subset to get a copy of the dataset. Use the copy in case
Can someone help me with this question:
instructions:
1. Do Tables -> Subset to get a copy of the dataset. Use the copy in case something doesn't work properly.
2. Select Tables -> Transpose
3. In the popup window, enter C1 C2 C3 in "Transpose Columns" option Click OK
4. Now we work with the Transposed dataset. Select Tables -> Stack and enter Row 2 ,Row 3, Row 4 in the "Stack Columns" option. Click OK
5. Rename Row 1 as X (Coded Nitrogen) and Data as Y
6. Save the "Untitled" dataset (eg. a3-refomat-done.jmp)
7. Get the correlations for both plots. Select Density Ellipse-> 0.50
8. Print the output [ Make sure the Correlation reports are open ]
questions to answer:
Reformat Y = Yield, X = Coded Nitrogen
(a) Reformat the data as explained in the JMP Notes. Print the reformatted dataset
(b) Add a new column (name it X2) and copy in the X entries. Change each X2=1 entry to 4
(c) Compute the correlations for Y versus X and X2
(d) Explain why the correlation may be misleading for ordinal data.
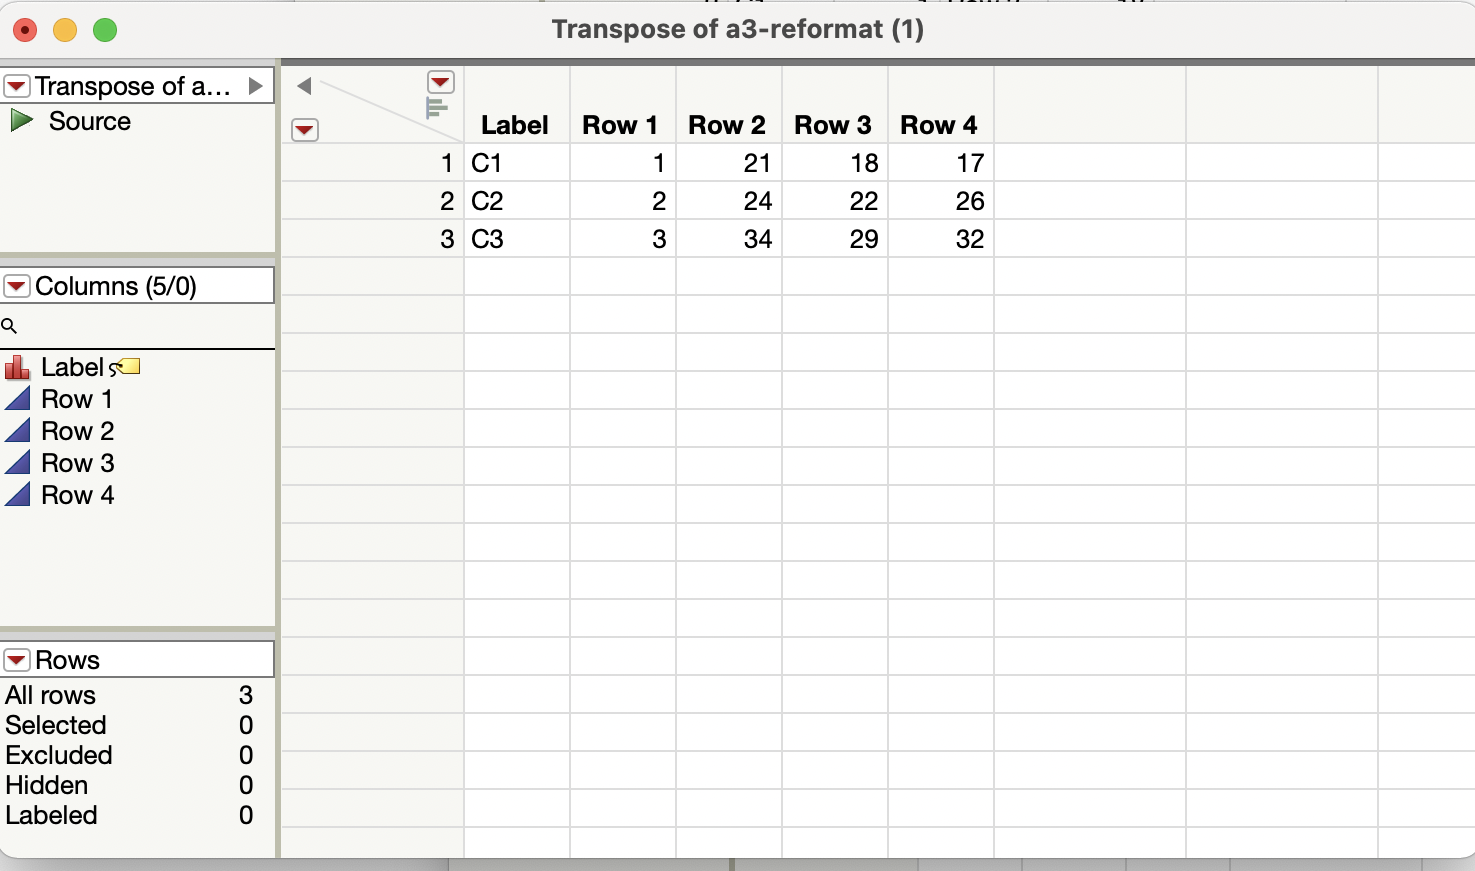
O Transpose of a3-reformat (1) Transpose of a... Source Label Row 1 Row 2 Row 3 Row 4 1 C1 21 18 17 2 C2 2 24 22 26 3 C3 3 34 29 32 Columns (5/0) Q Labels Row 1 Row 2 Row 3 Row 4 Rows All rows Selected Excluded ooo ow Hidden Labeled
Step by Step Solution
There are 3 Steps involved in it

Get step-by-step solutions from verified subject matter experts