

Question: Can someone help me with this R code? Question 3. For each of the following data sets use R to i) sketch a scatterplot and
Can someone help me with this R code?
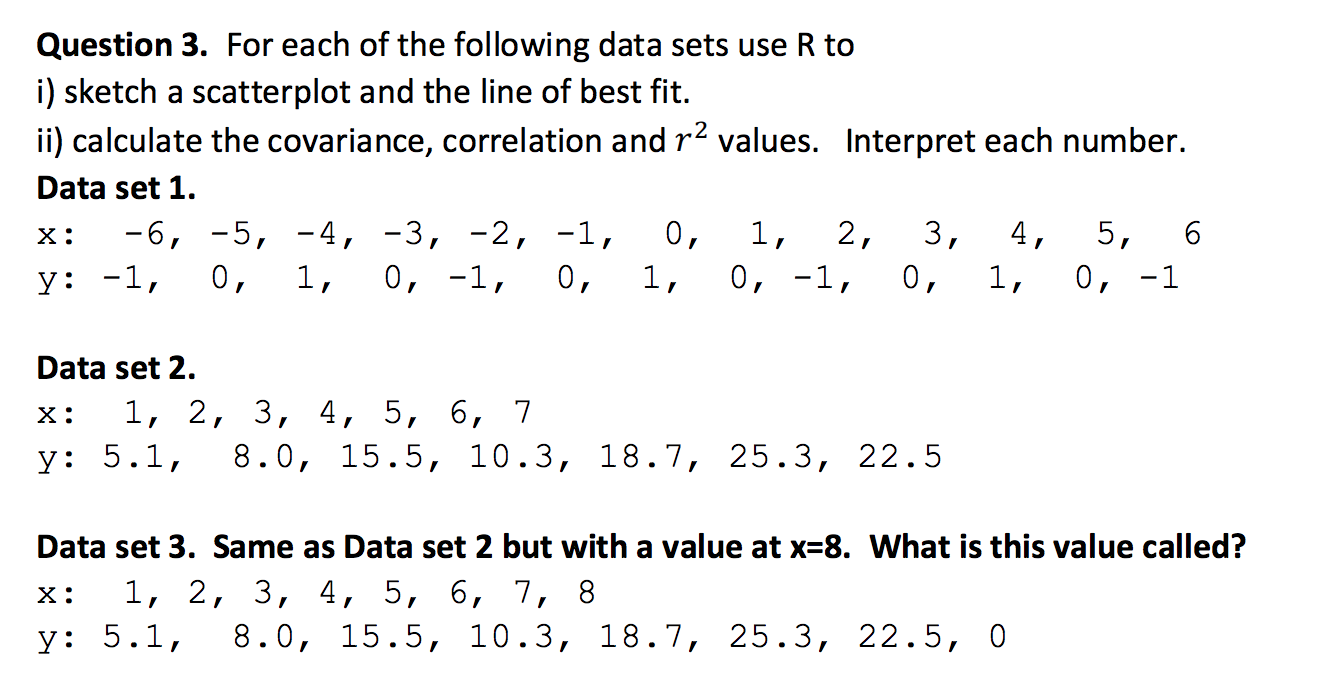
Question 3. For each of the following data sets use R to i) sketch a scatterplot and the line of best fit. ii) calculate the covariance, correlation and r values. Interpret each number. Data set 1. X : -6, -5, -4, -3, -2, -1, 0, 1, 2, 3, 5 , 6 y : -1, 0 , 1 , 0, -1, 0, 1, 0, -1, 0 , 1, 0 , -1 Data set 2. X: 1, 2, 3, 4, 5, 6, 7 y: 5.1, 8.0, 15.5, 10.3, 18.7, 25.3, 22.5 Data set 3. Same as Data set 2 but with a value at x=8. What is this value called? X : 1, 2, 3, 4, 5, 6, 7, 8 y: 5.1, 8.0, 15.5, 10.3, 18.7, 25.3, 22.5, 0
Step by Step Solution
There are 3 Steps involved in it
1 Expert Approved Answer
Step: 1 Unlock

Question Has Been Solved by an Expert!
Get step-by-step solutions from verified subject matter experts
Step: 2 Unlock
Step: 3 Unlock