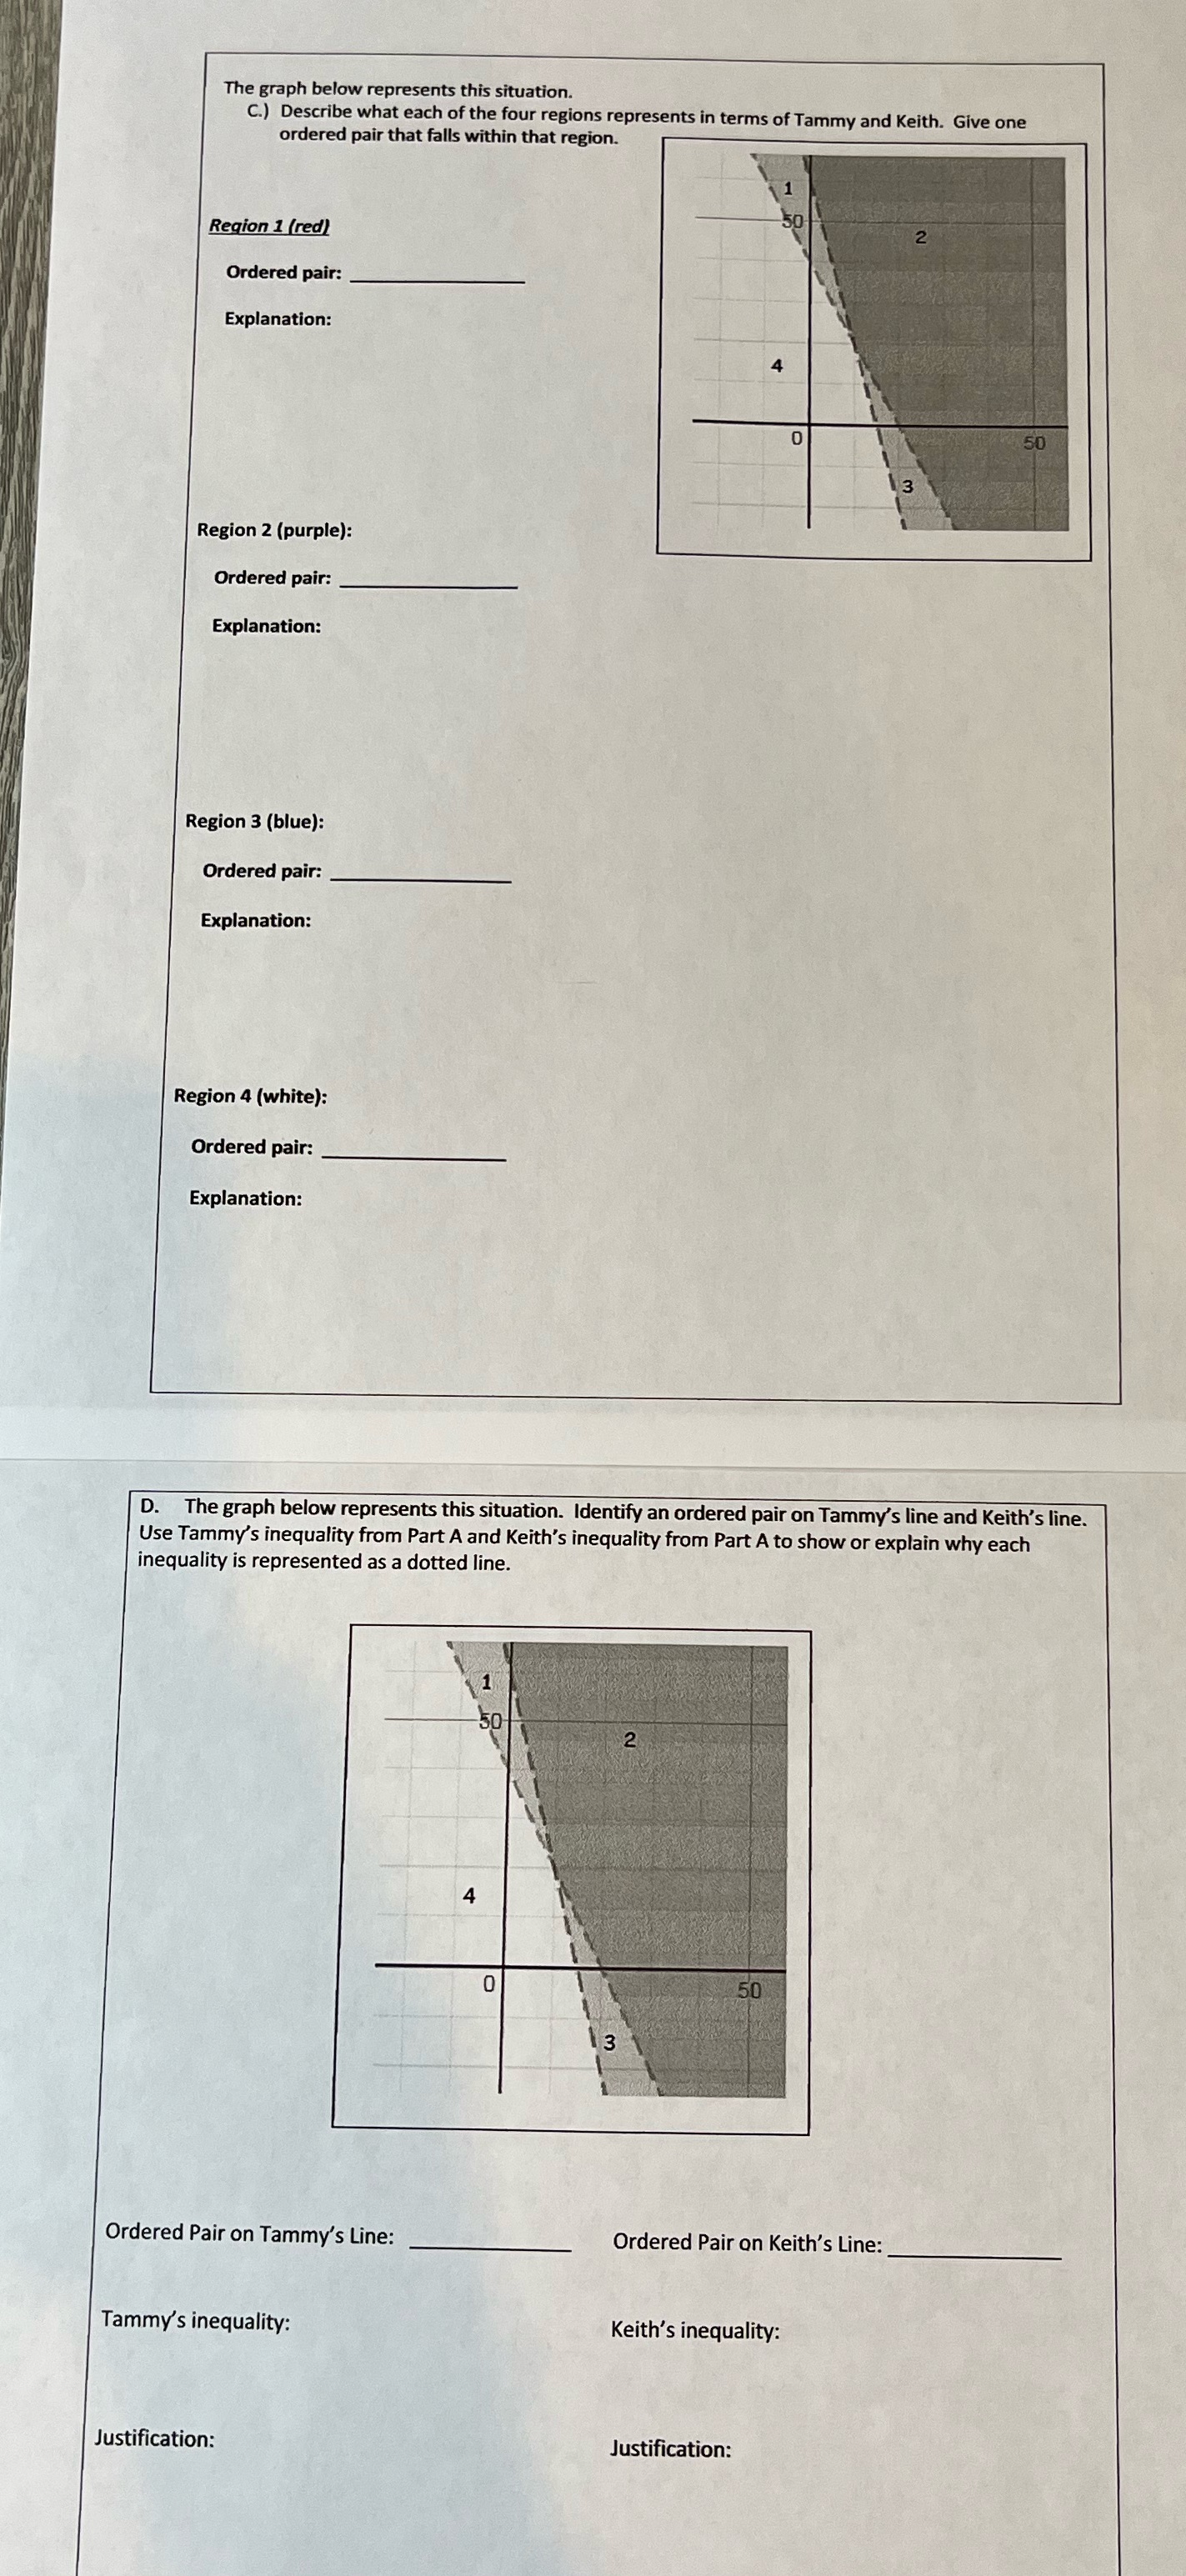
Question: Can someone help me with this? The graph below represents this situation. C.) Describe what each of the four regions represents in terms of Tammy

Can someone help me with this?

Can someone help me with this? The graph below
The graph below represents this situation. C.) Describe what each of the four regions represents in terms of Tammy and Keith. Give one ordered pair that falls within that region. Region 1 (red) Ordered pair: Explanation: 0 50 3 Region 2 (purple): Ordered pair: Explanation: Region 3 (blue): Ordered pair: Explanation: Region 4 (white): Ordered pair: Explanation: D. The graph below represents this situation. Identify an ordered pair on Tammy's line and Keith's line. Use Tammy's inequality from Part A and Keith's inequality from Part A to show or explain why each inequality is represented as a dotted line. 50 50 Ordered Pair on Tammy's Line: Ordered Pair on Keith's Line: Tammy's inequality: Keith's inequality: Justification: Justification

Step by Step Solution

There are 3 Steps involved in it

1 Expert Approved Answer
Step: 1 Unlock blur-text-image
Question Has Been Solved by an Expert!

Get step-by-step solutions from verified subject matter experts

Step: 2 Unlock
Step: 3 Unlock

Students Have Also Explored These Related Mathematics Questions!