

Question: Can someone help with the steps on how to do this in excel ASAP (4 points) You are planning to invest your money in Stock
 Can someone help with the steps on how to do this in excel ASAP
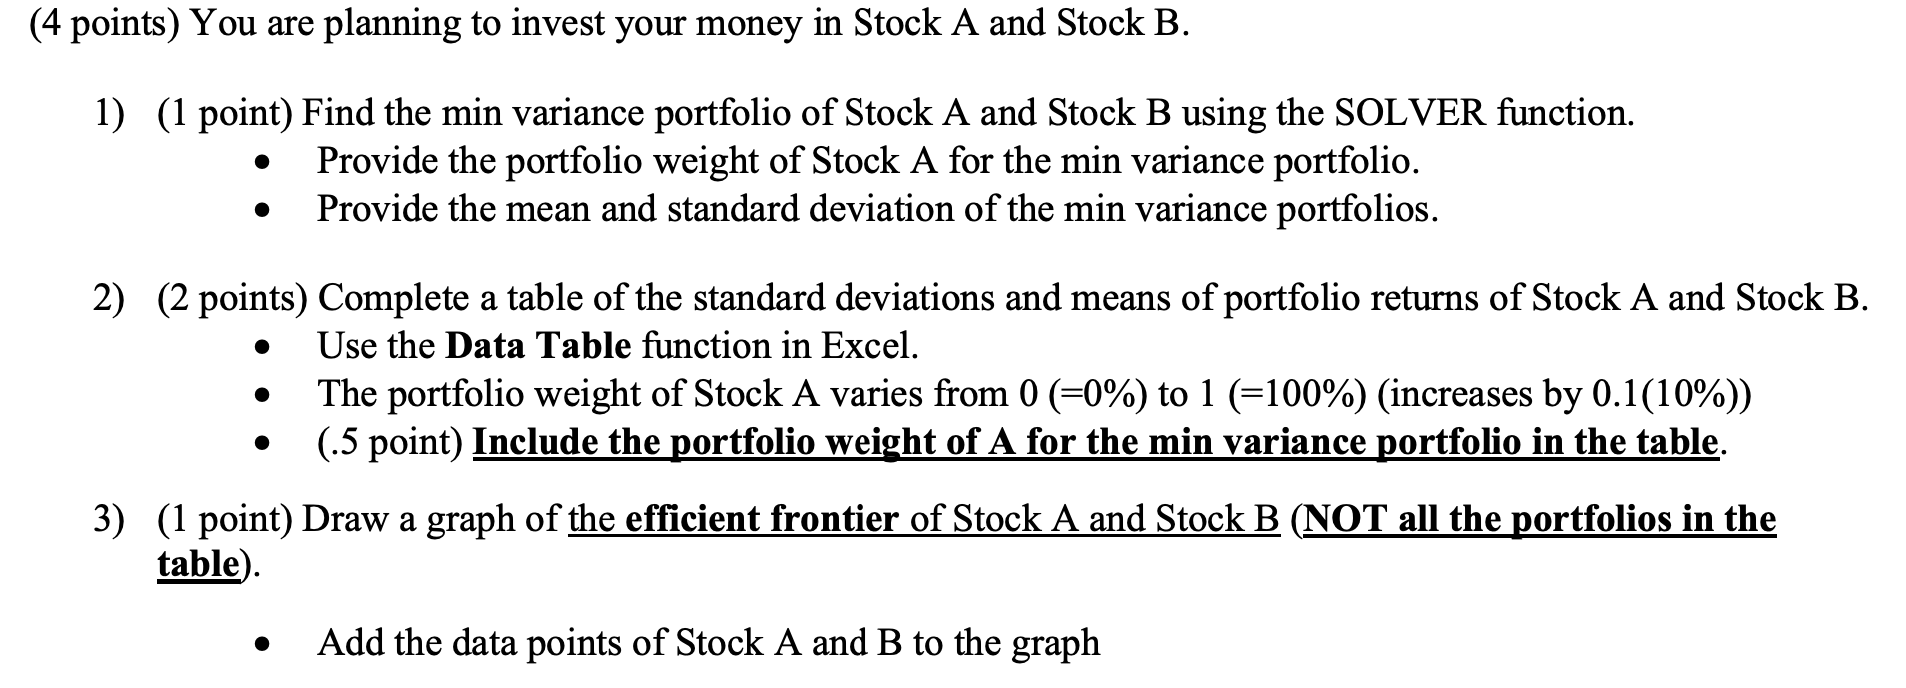
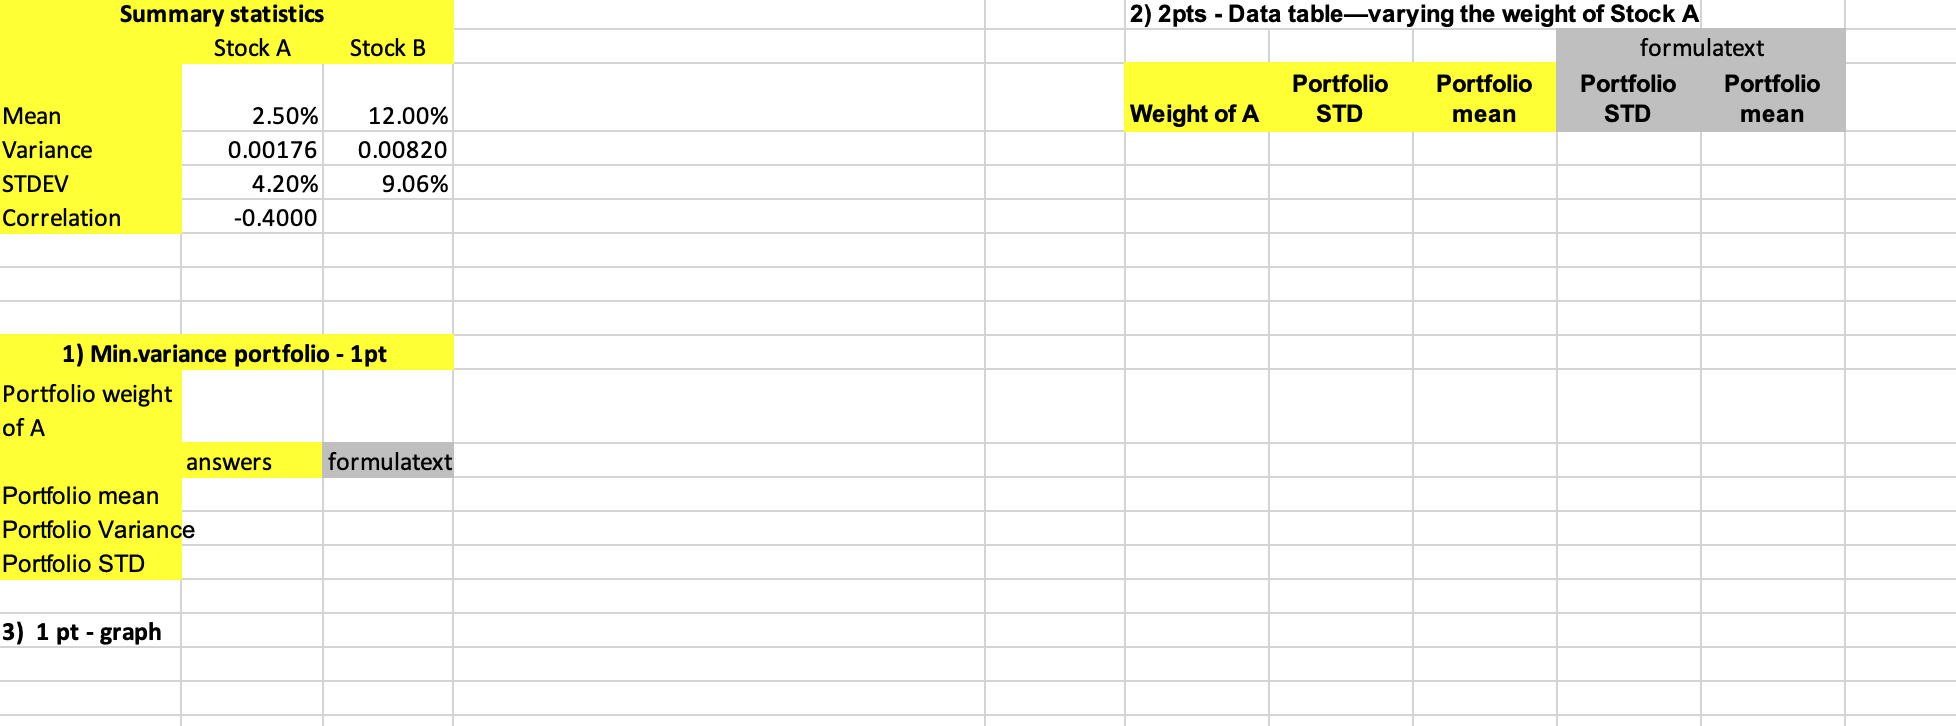
(4 points) You are planning to invest your money in Stock A and Stock B. 1) (1 point) Find the min variance portfolio of Stock A and Stock B using the SOLVER function. Provide the portfolio weight of Stock A for the min variance portfolio. Provide the mean and standard deviation of the min variance portfolios. . 2) (2 points) Complete a table of the standard deviations and means of portfolio returns of Stock A and Stock B. Use the Data Table function in Excel. The portfolio weight of Stock A varies from 0 (50%) to 1 (=100%) (increases by 0.1(10%) (.5 point) Include the portfolio weight of A for the min variance portfolio in the table. 3) (1 point) Draw a graph of the efficient frontier of Stock A and Stock B (NOT all the portfolios in the table). . Add the data points of Stock A and B to the graph Summary statistics Stock A Stock B 2) 2pts - Data table-varying the weight of Stock A formulatext Portfolio Portfolio Portfolio Portfolio Weight of A STD mean STD mean Mean Variance STDEV Correlation 2.50% 0.00176 4.20% -0.4000 12.00% 0.00820 9.06% 1) Min.variance portfolio - 1 pt Portfolio weight of A answers formulatext Portfolio mean Portfolio Variance Portfolio STD 3) 1 pt - graph (4 points) You are planning to invest your money in Stock A and Stock B. 1) (1 point) Find the min variance portfolio of Stock A and Stock B using the SOLVER function. Provide the portfolio weight of Stock A for the min variance portfolio. Provide the mean and standard deviation of the min variance portfolios. . 2) (2 points) Complete a table of the standard deviations and means of portfolio returns of Stock A and Stock B. Use the Data Table function in Excel. The portfolio weight of Stock A varies from 0 (50%) to 1 (=100%) (increases by 0.1(10%) (.5 point) Include the portfolio weight of A for the min variance portfolio in the table. 3) (1 point) Draw a graph of the efficient frontier of Stock A and Stock B (NOT all the portfolios in the table). . Add the data points of Stock A and B to the graph Summary statistics Stock A Stock B 2) 2pts - Data table-varying the weight of Stock A formulatext Portfolio Portfolio Portfolio Portfolio Weight of A STD mean STD mean Mean Variance STDEV Correlation 2.50% 0.00176 4.20% -0.4000 12.00% 0.00820 9.06% 1) Min.variance portfolio - 1 pt Portfolio weight of A answers formulatext Portfolio mean Portfolio Variance Portfolio STD 3) 1 pt - graph
Step by Step Solution
There are 3 Steps involved in it

Get step-by-step solutions from verified subject matter experts