

Question: Can someone help with these please Histogram Use the histogram below complete the statements. The mean of the data set is 45 and the standard
Can someone help with these please
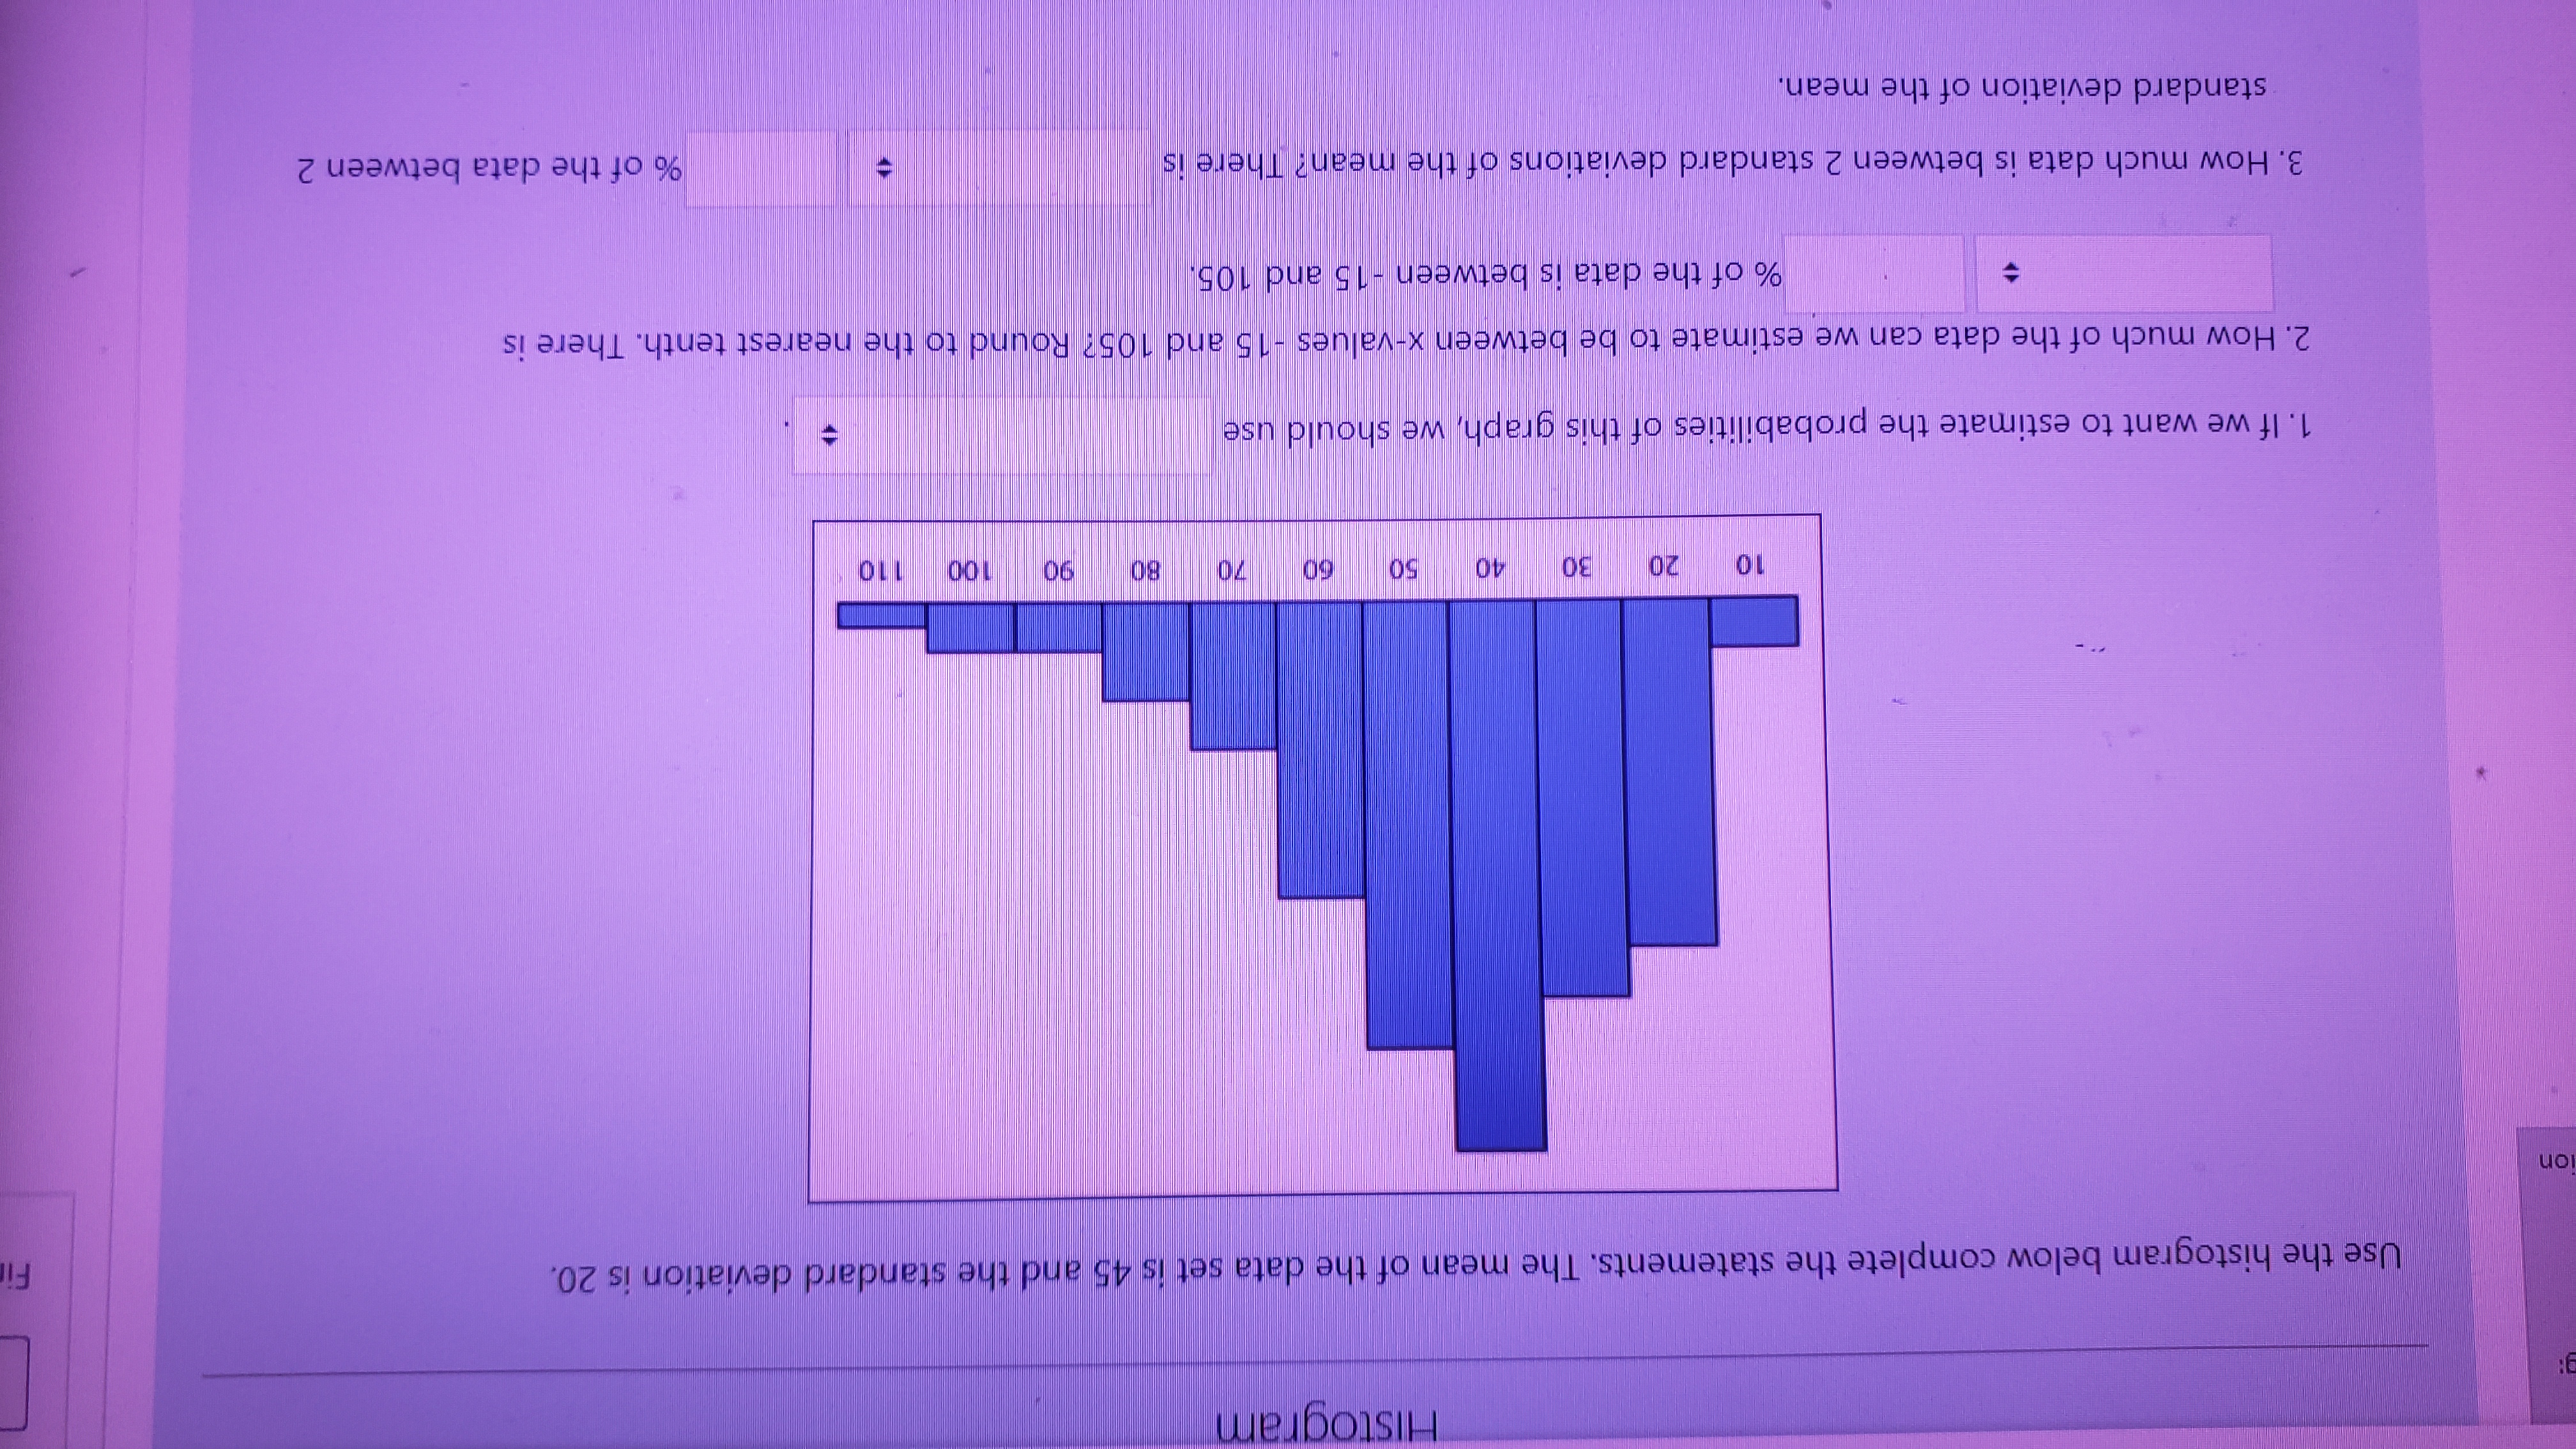
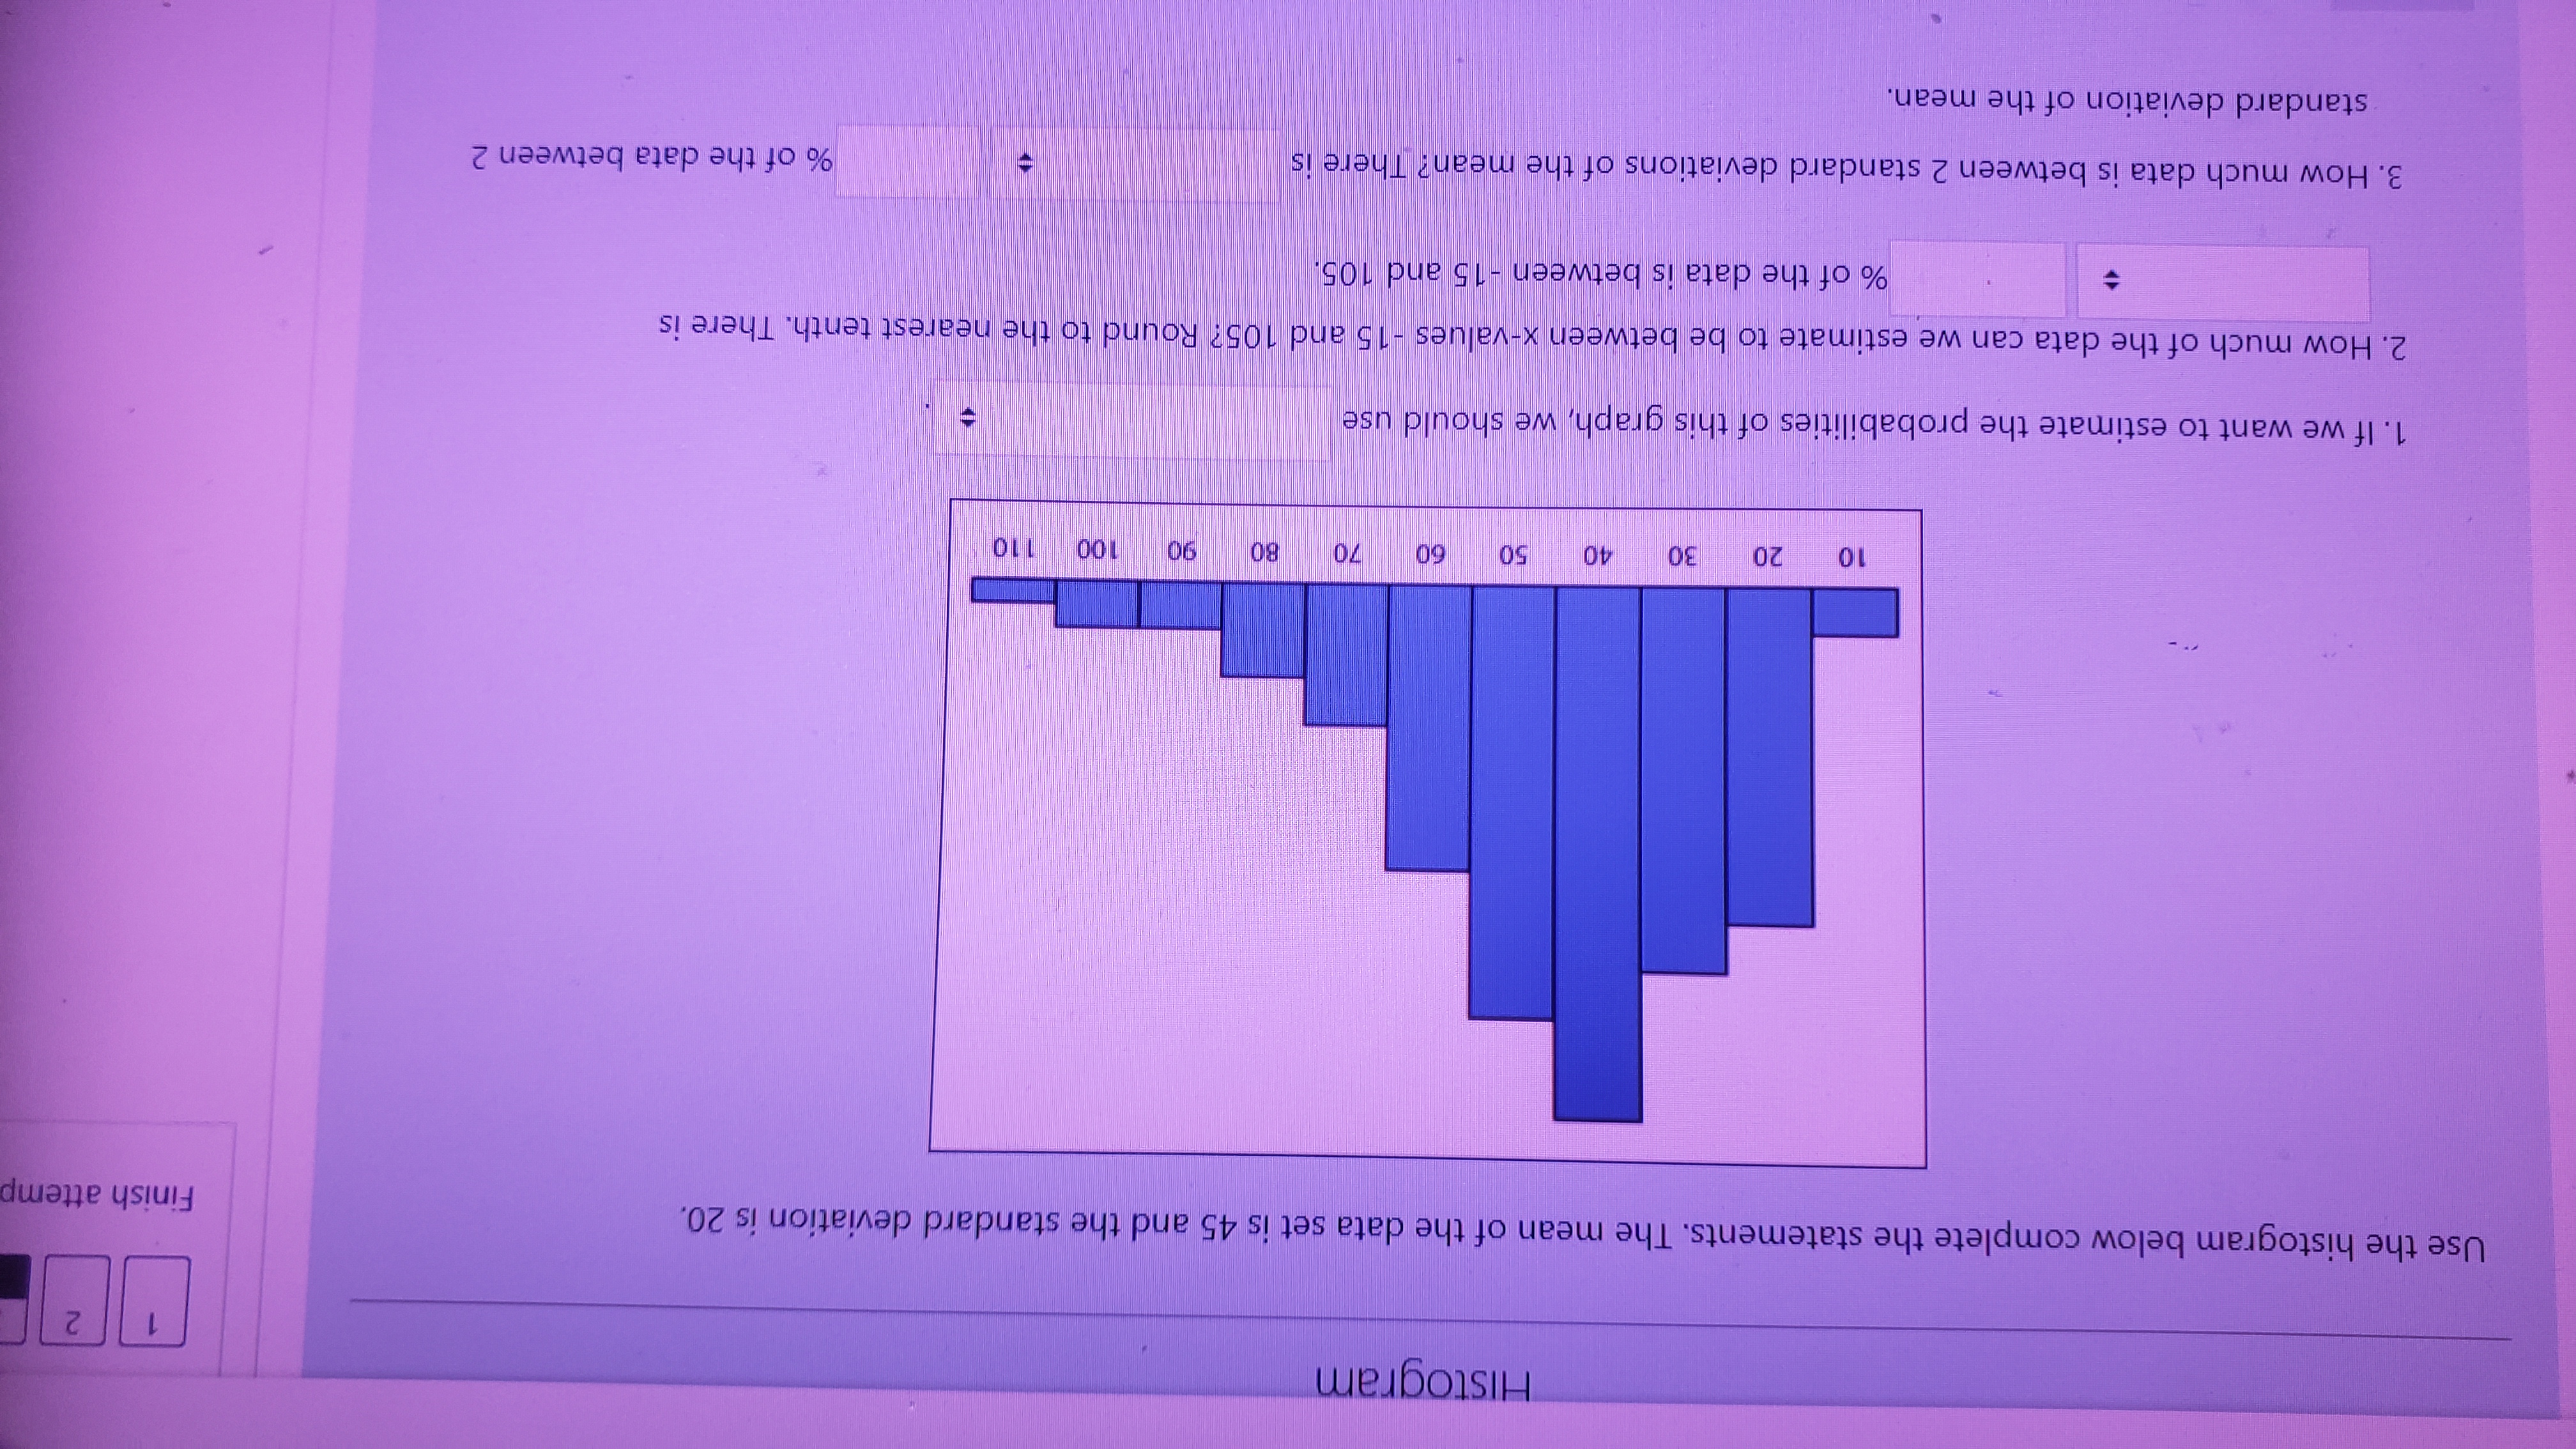
Histogram Use the histogram below complete the statements. The mean of the data set is 45 and the standard deviation is 20. Fi Ion 10 20 30 40 50 60 70 80 90 100 110 1. If we want to estimate the probabilities of this graph, we should use 2. How much of the data can we estimate to be between x-values -15 and 1057 Round to the nearest tenth. There is % of the data is between - 15 and 105. 3. How much data is between 2 standard deviations of the mean? There is % of the data between 2 standard deviation of the mean.Histogram 2 Use the histogram below complete the statements. The mean of the data set is 45 and the standard deviation is 20. Finish attemp 10 20 30 40 50 60 70 80 90 100 110 1. If we want to estimate the probabilities of this graph, we should use 2. How much of the data can we estimate to be between x-values -15 and 105? Round to the nearest tenth. There is % of the data is between - 15 and 105. 3. How much data is between 2 standard deviations of the mean? There is % of the data between 2 standard deviation of the mean
Step by Step Solution
There are 3 Steps involved in it

Get step-by-step solutions from verified subject matter experts