

Question: can someone just explain how to do these? like a general overview. I can't get them to work In Filter2 worksheet, filter the data to
can someone just explain how to do these? like a general overview. I can't get them to work
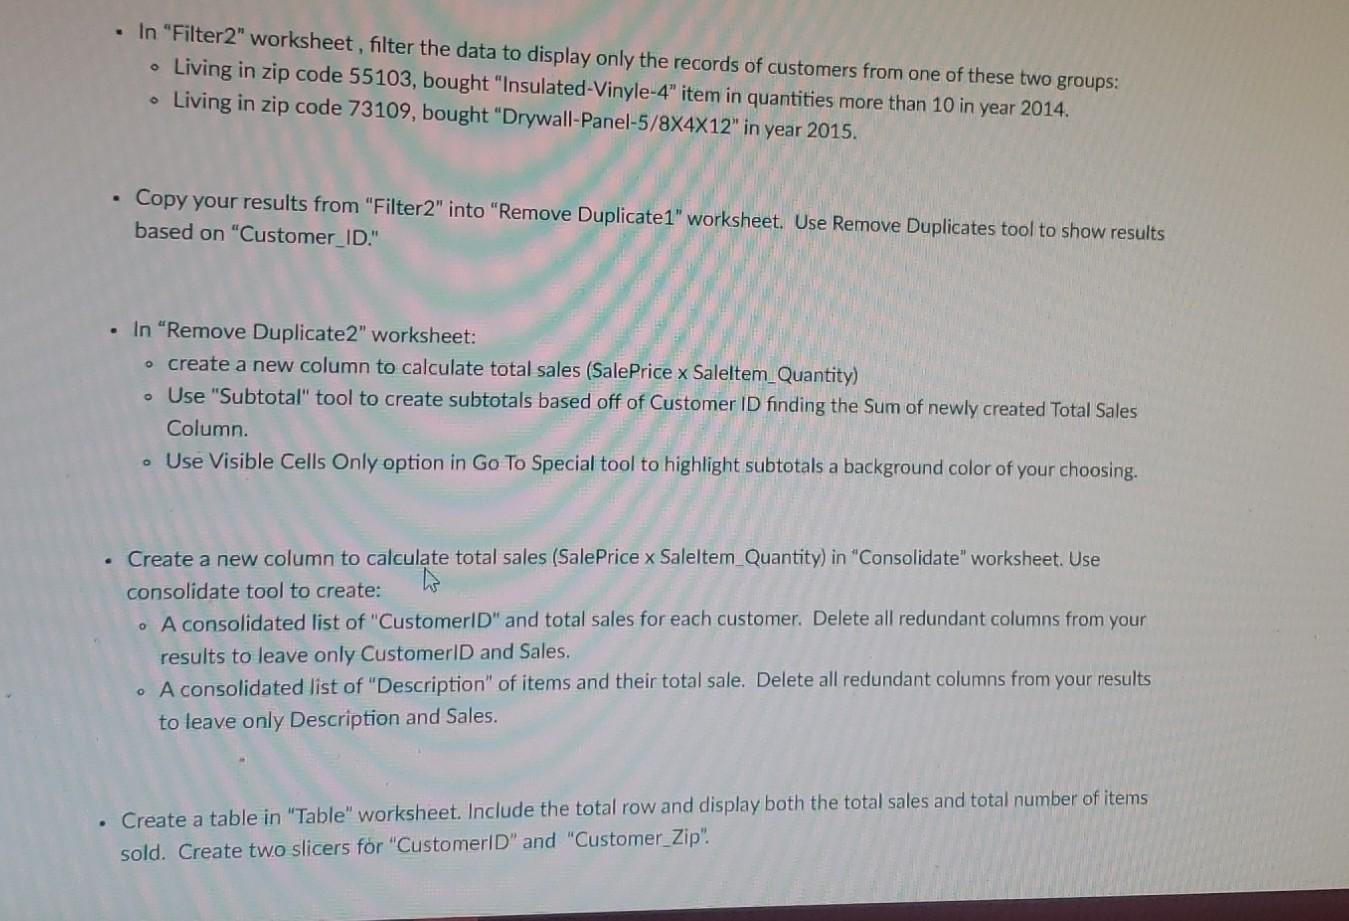
In "Filter2" worksheet, filter the data to display only the records of customers from one of these two groups: Living in zip code 55103, bought "Insulated-Vinyle-4" item in quantities more than 10 in year 2014. Living in zip code 73109, bought "Drywall-Panel-5/8X4X12" in year 2015. o Copy your results from "Filter2" into "Remove Duplicate1" worksheet. Use Remove Duplicates tool to show results based on "Customer_ID." . In "Remove Duplicate2" worksheet: o create a new column to calculate total sales (SalePrice x Saleltem Quantity) o Use "Subtotal" tool to create subtotals based off of Customer ID finding the Sum of newly created Total Sales Column . Use Visible Cells Only option in Go To Special tool to highlight subtotals a background color of your choosing. Create a new column to calculate total sales (Sale Price x Saleltem Quantity) in "Consolidate" worksheet. Use consolidate tool to create: A consolidated list of "Customer D" and total sales for each customer. Delete all redundant columns from your results to leave only CustomerlD and Sales. . A consolidated list of "Description" of items and their total sale. Delete all redundant columns from your results to leave only Description and Sales. . Create a table in "Table" worksheet. Include the total row and display both the total sales and total number of items sold. Create two slicers for "CustomerlD" and "Customer_Zip
Step by Step Solution
There are 3 Steps involved in it

Get step-by-step solutions from verified subject matter experts