

Question: Can someone look over my work and correct it and help me complete the table? 10 12 In a random sample of 208 potential voters
Can someone look over my work and correct it and help me complete the table?
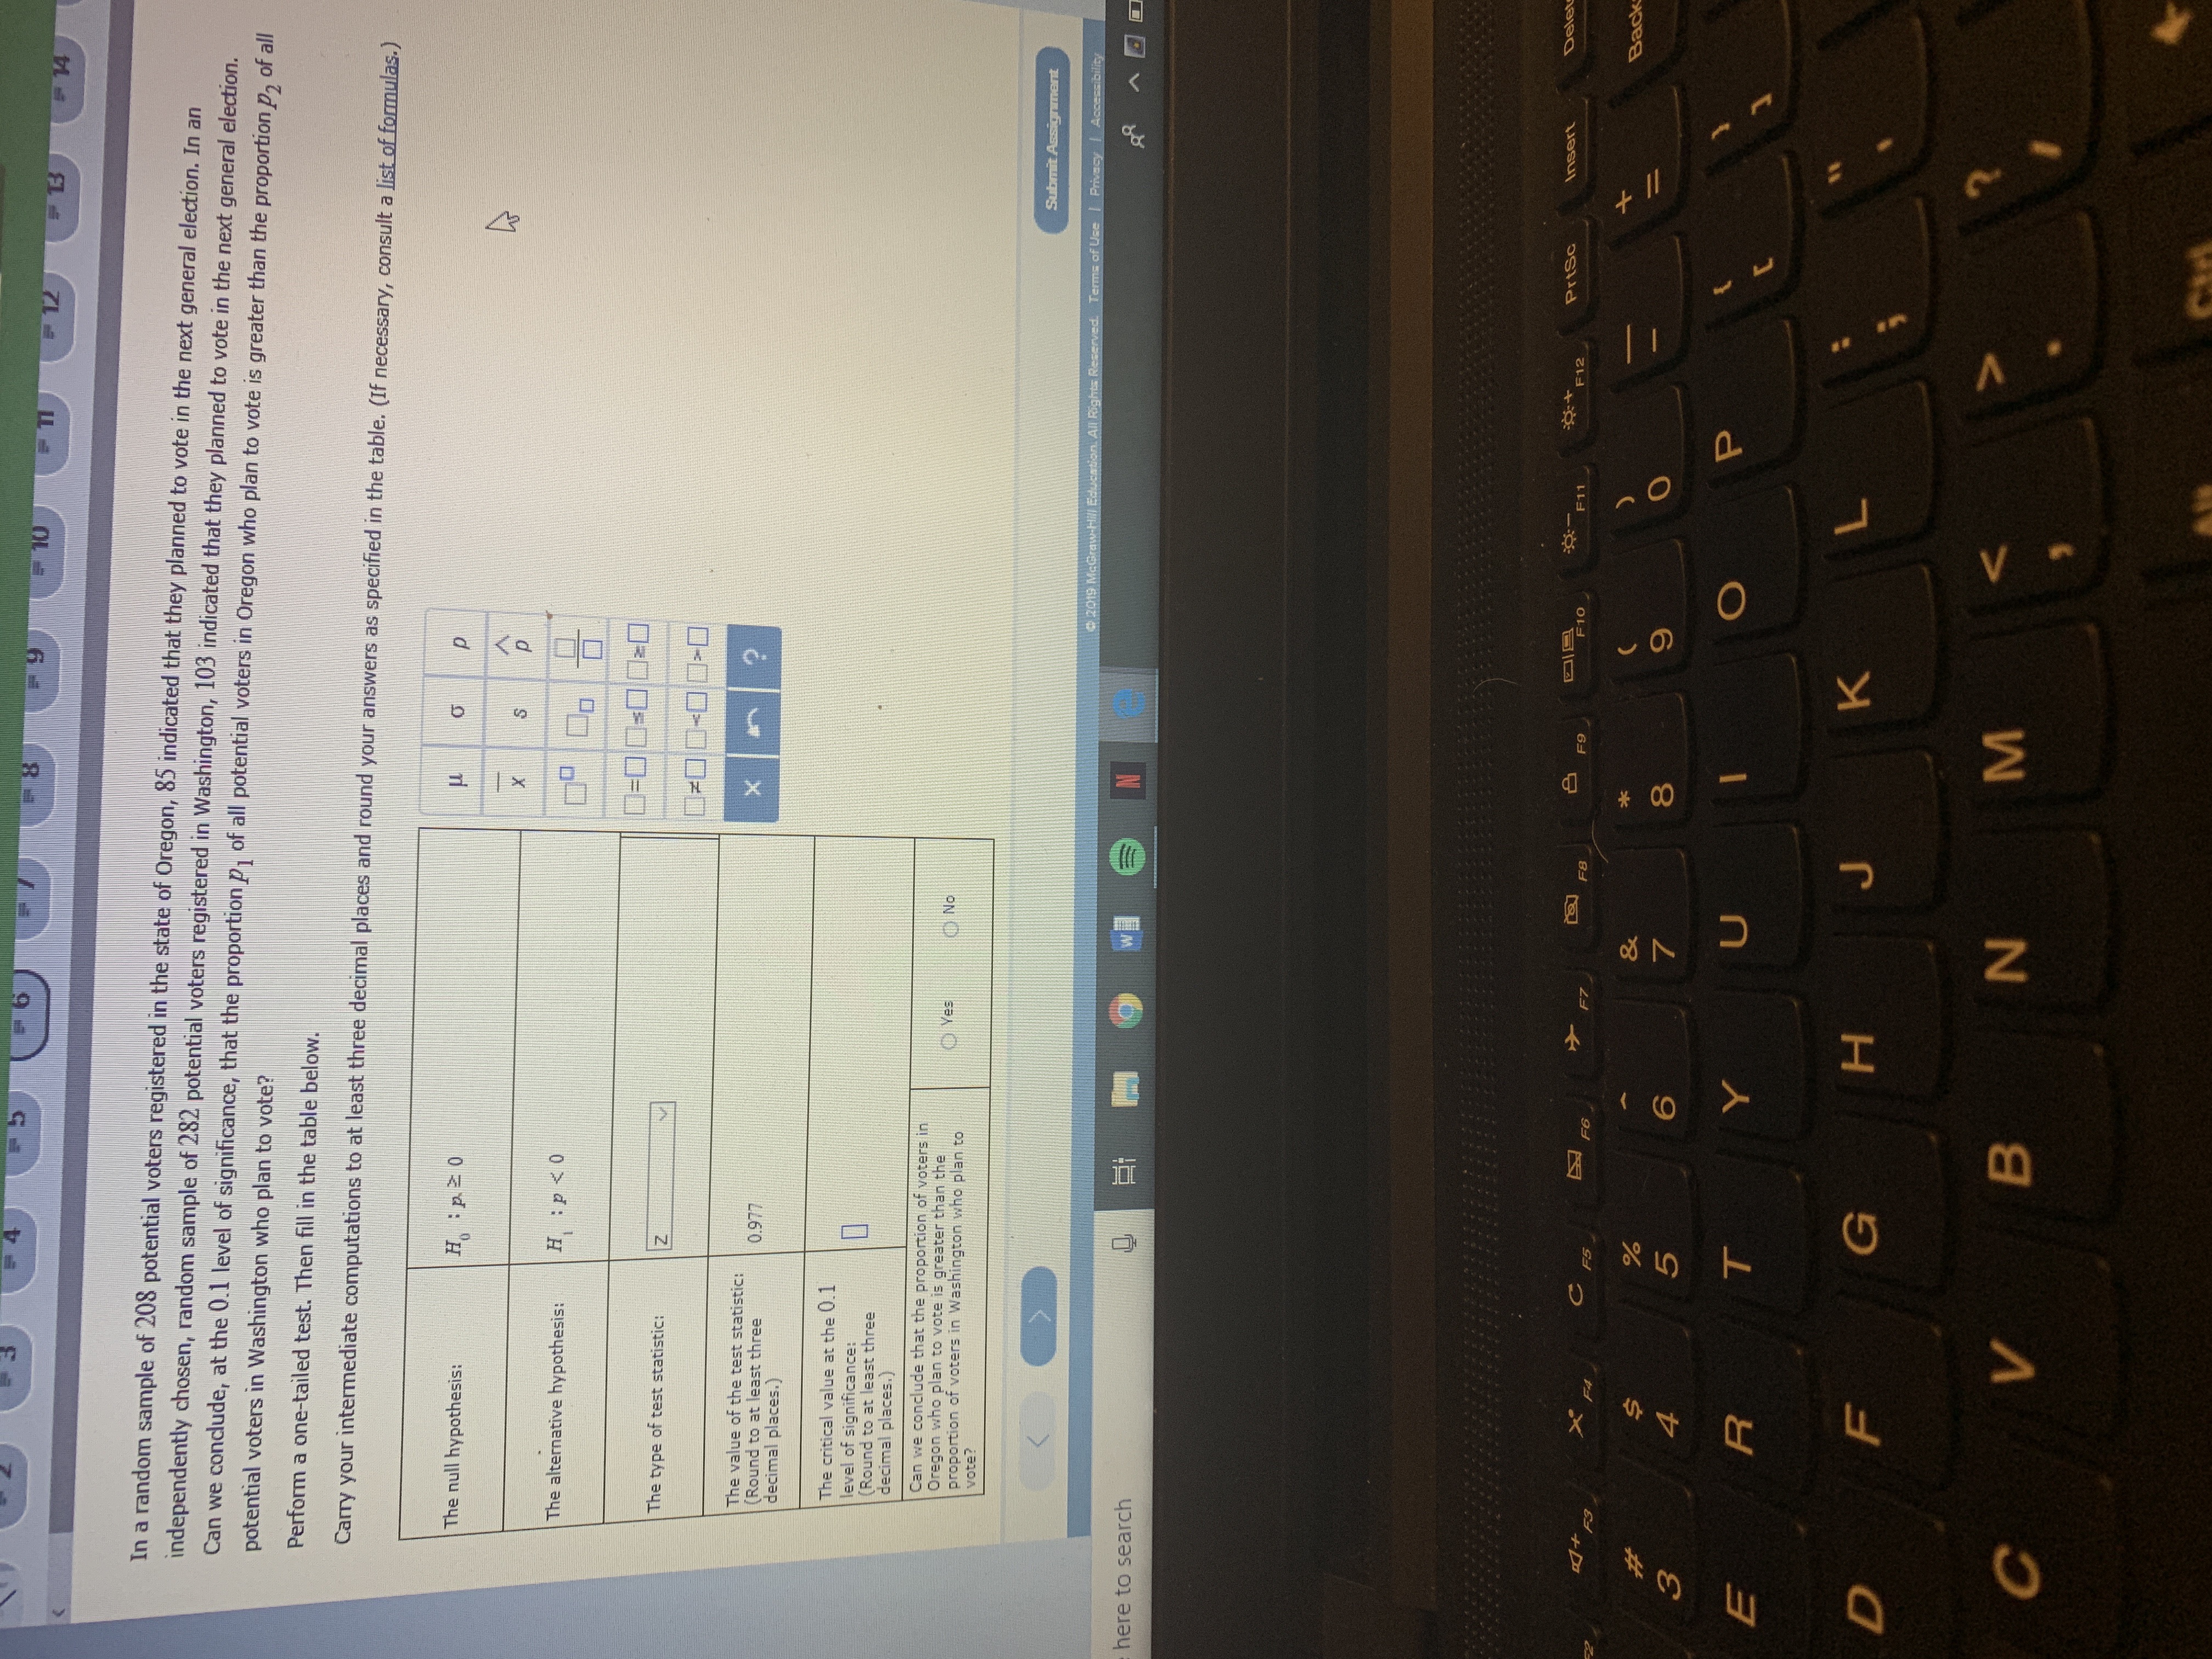
10 12 In a random sample of 208 potential voters registered in the state of Oregon, 85 indicated that they planned to vote in the next general election. In an independently chosen, random sample of 282 potential voters registered in Washington, 103 indicated that they planned to vote in the next general election. Can we conclude, at the 0.1 level of significance, that the proportion , of all potential voters in Oregon who plan to vote is greater than the proportion p, of all potential voters in Washington who plan to vote? Perform a one-tailed test. Then fill in the table below. Carry your intermediate computations to at least three decimal places and round your answers as specified in the table. (If necessary, consult a list of formulas.) The null hypothesis: H :P.=0 P Y S p The alternative hypothesis: H :p
Step by Step Solution
There are 3 Steps involved in it

Get step-by-step solutions from verified subject matter experts