

Question: Can someone please convert this data into a bar chart? With Sales and Net Income Forecast for years 2019-2021 A B D YEAR 2019 2020
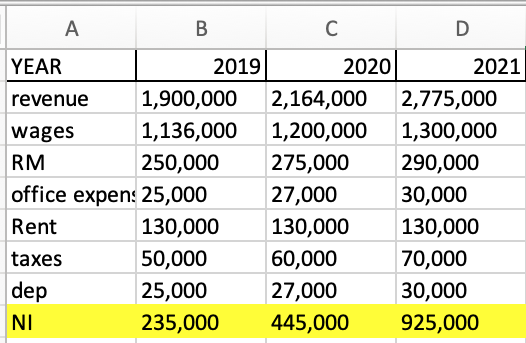
Can someone please convert this data into a bar chart? With Sales and Net Income Forecast for years 2019-2021
A B D YEAR 2019 2020 revenue 1,900,000 2,164,000 wages 1,136,000 1,200,000 RM 250,000 275,000 office expen: 25,000 27,000 Rent 130,000 130,000 taxes 50,000 60,000 dep 25,000 27,000 NI 235,000 445,000 2021 2,775,000 1,300,000 290,000 30,000 130,000 70,000 30,000 925,000
Step by Step Solution
There are 3 Steps involved in it
1 Expert Approved Answer
Step: 1 Unlock

Question Has Been Solved by an Expert!
Get step-by-step solutions from verified subject matter experts
Step: 2 Unlock
Step: 3 Unlock