

Question: can someone please explain how to draw the graph for this worksheet. i'm not 100% positive the values are correct (specifically bottom left corner) A
can someone please explain how to draw the graph for this worksheet. i'm not 100% positive the values are correct (specifically bottom left corner)
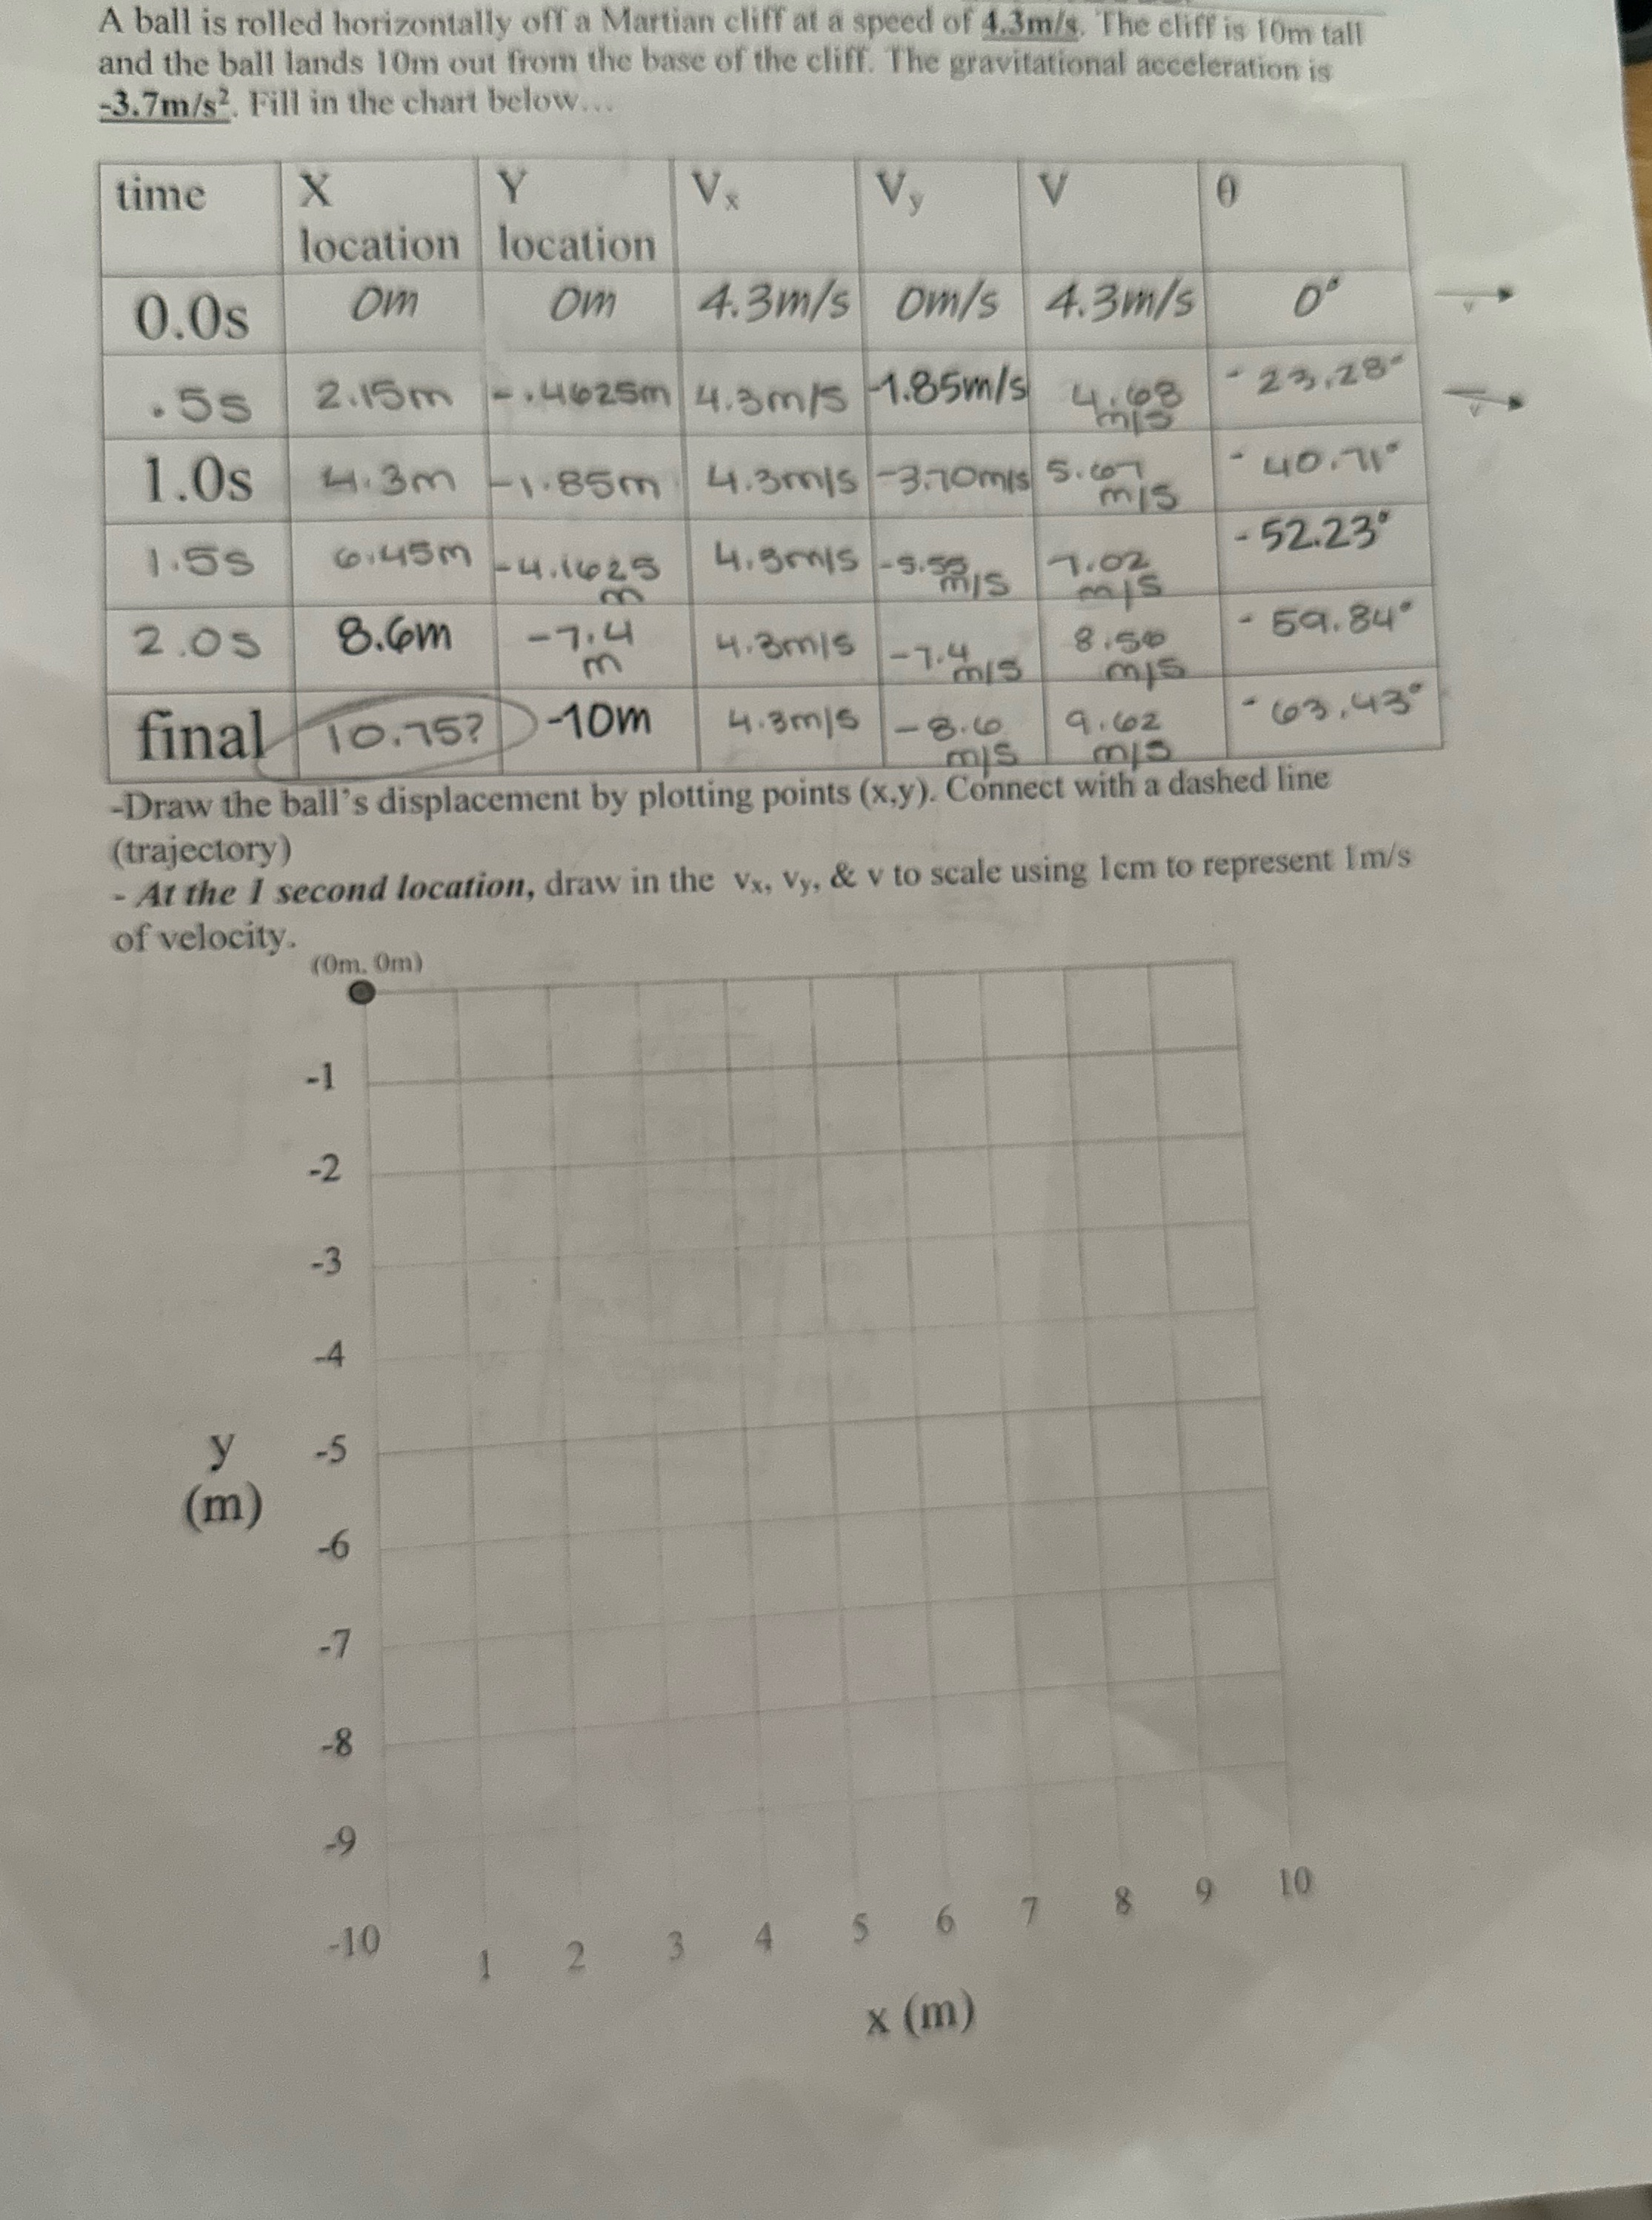
A ball is rolled horizontally off a Martian cliff at a speed of 4.3m/s. The cliff is 10m tall and the ball lands 10m out from the base of the cliff. The gravitational acceleration is -3.7m/s2. Fill in the chart below... time X V x Vy location location 0.0s Om om 4.3m/s om/s 4.3m/s . 5s 2.15 m -4625m / 4.5m/S -1.85m/s 4. 68 -23,28- 1.0s 4:3m -1 85m 4.3mis -3.70 mis 5.607 - 410:71" mis 1.5s 6:45m - 4. 1625 4. Brn15 - 5.5815 - 52.23 1.02 mis 2.05 8.4m -7:4 4.3 m/s -7.4 8.50 - 59.84" mis mis final 10.75? -10m 4.3m/s - 8.6 9.62 -63, 43" -Draw the ball's displacement by plotting points (x,y). Connect with a dashed line (trajectory) - At the 1 second location, draw in the Vx, Vy, & v to scale using Icm to represent Im/s of velocity. (0m. 0m) -1 -2 -3 -5 ( m) -6 -7 -8 -9 8 9 10 -10 2 3 4 S 6 7 1 x (m)
Step by Step Solution
There are 3 Steps involved in it

Get step-by-step solutions from verified subject matter experts