

Question: Can someone please explain how to draw the graph for this problem using the chart. Im not 100% the values are correct (such as bottom
Can someone please explain how to draw the graph for this problem using the chart. Im not 100% the values are correct (such as bottom left corner).

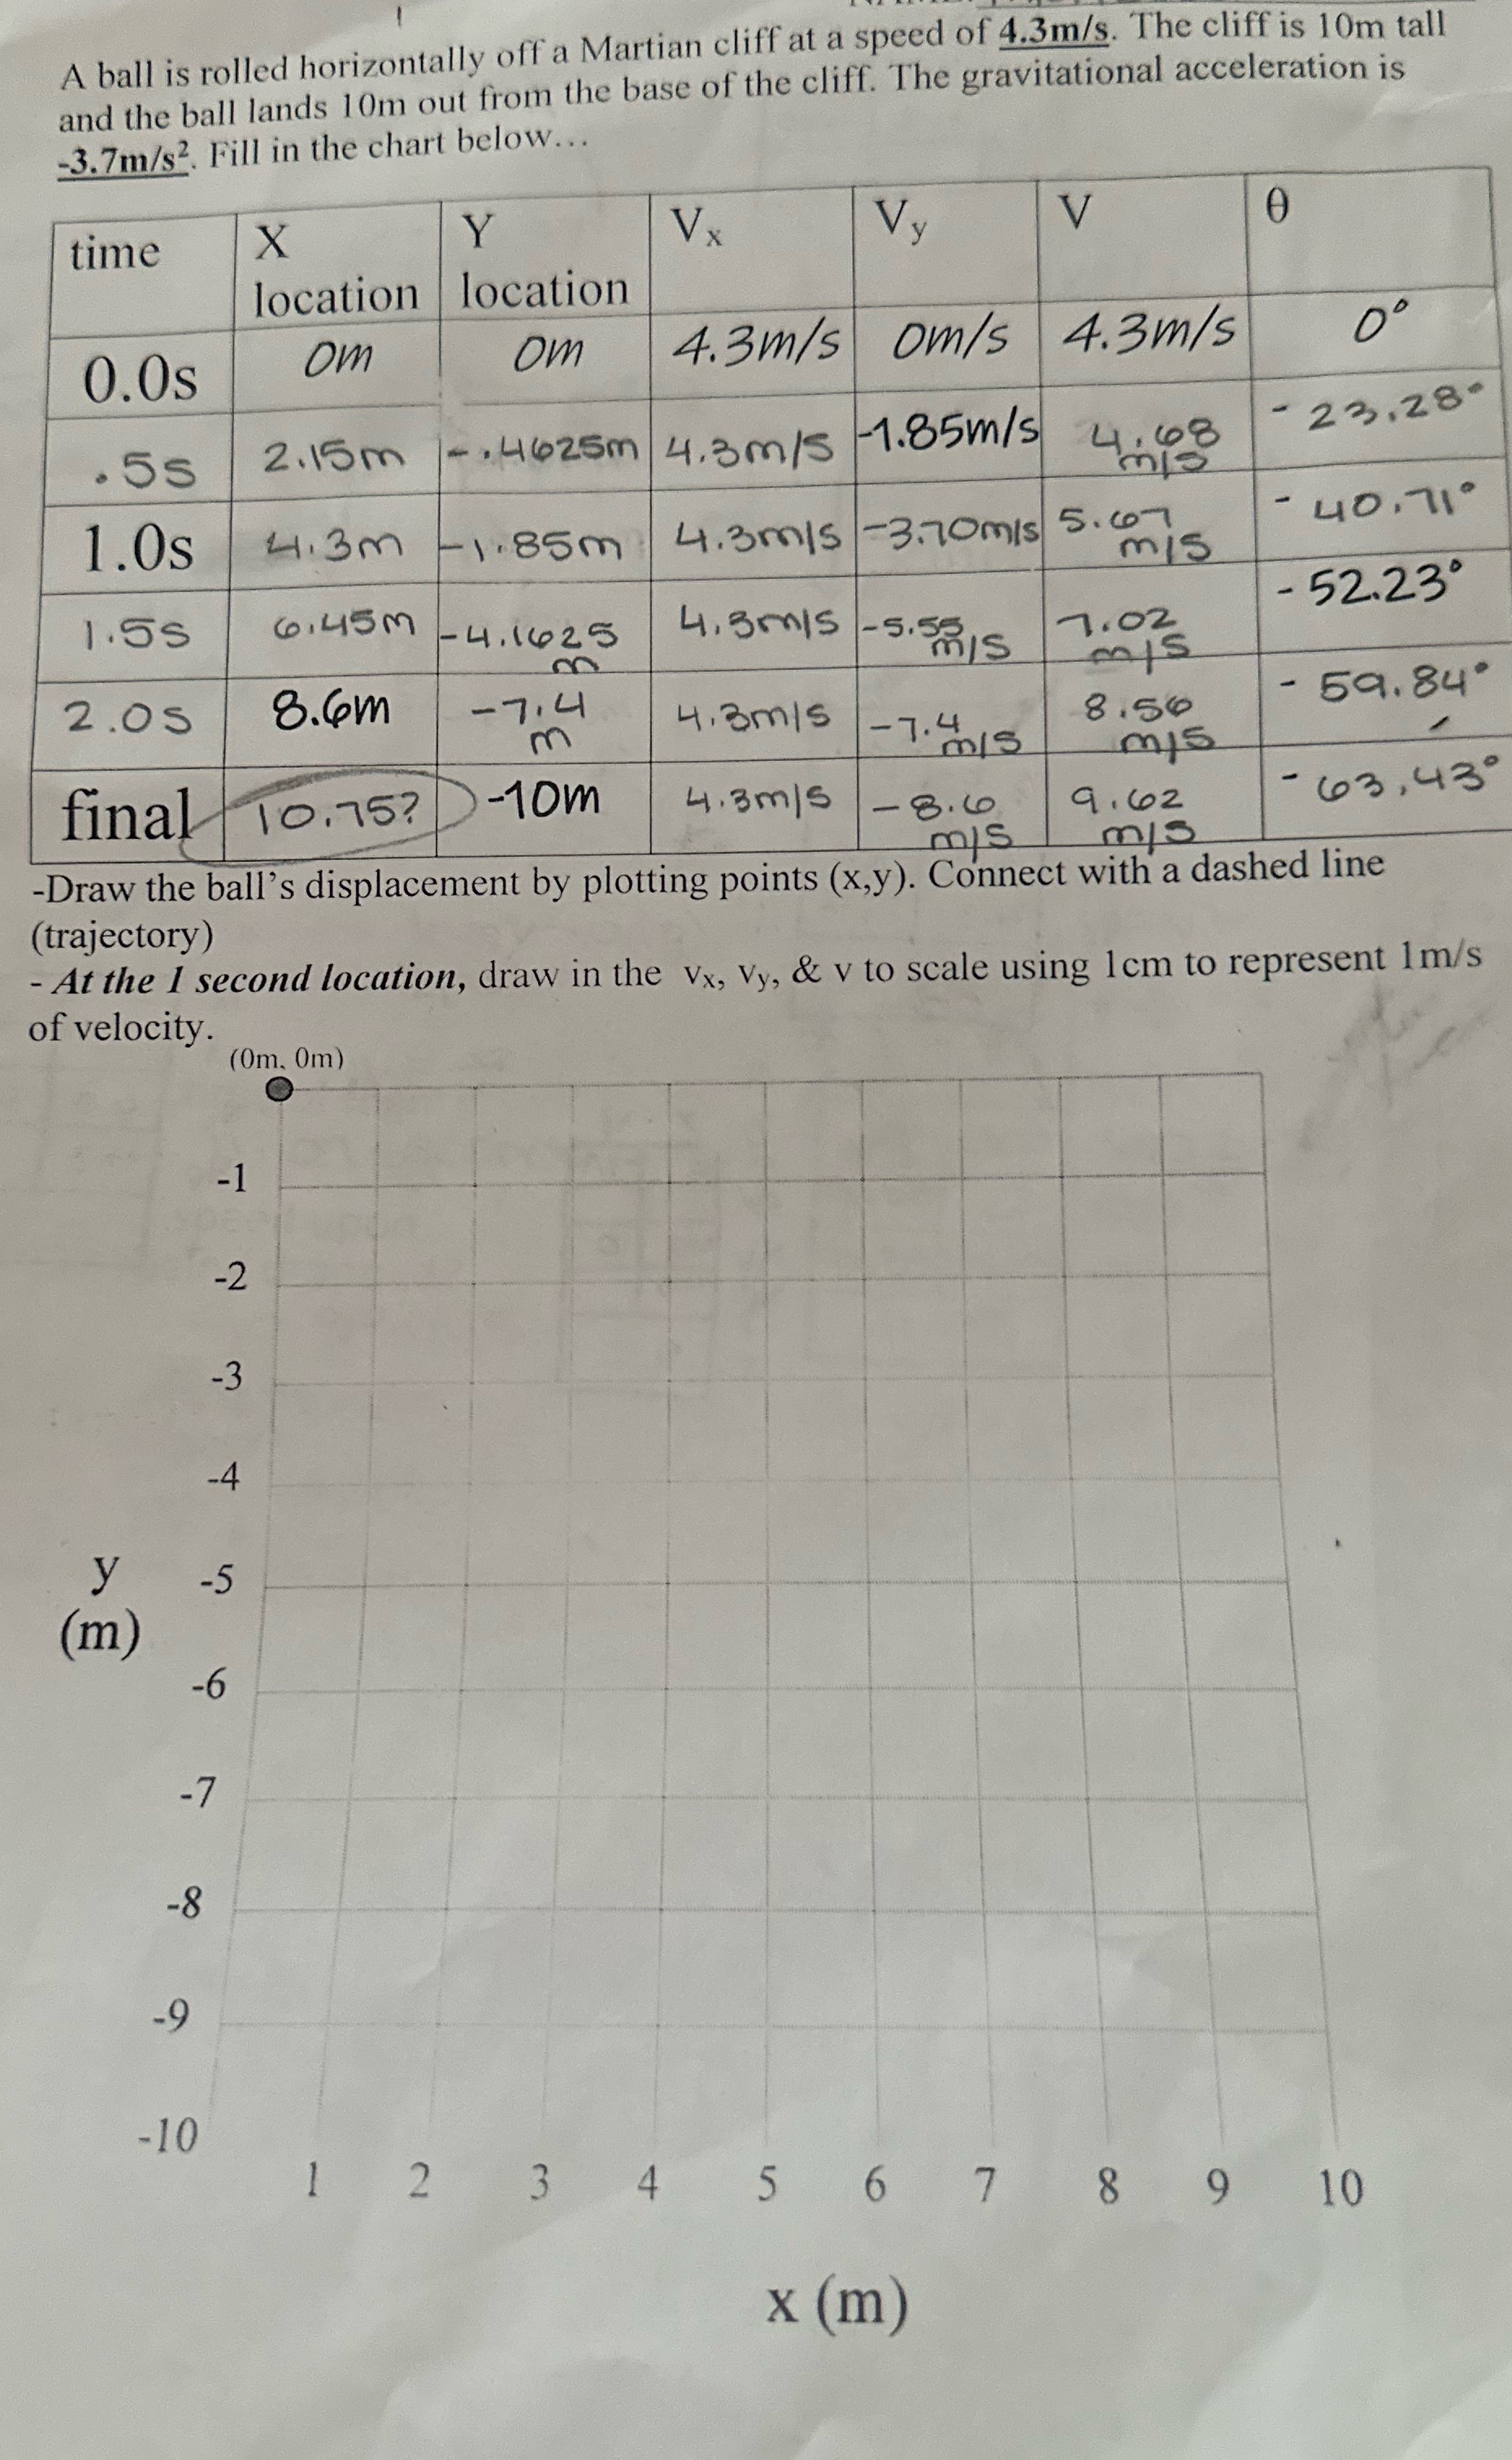
A ball is rolled horizontally off a Martian cliff at a speed of 4.3m/s. The cliff is 10m tall and the ball lands 10m out from the base of the cliff. The gravitational acceleration is -3.7m/s2. Fill in the chart below... time X Y V x Vy V location location 0.0s om om 4.3m/s om/s | 4.3m/s 2.15m /- ,4625m/ 4.3m/S / -1.85m/s/ 4, 68 - 23, 28 0 . 5s 1.0s 4:3m -1:85m 4.3m/s / - 3.70 m/s 5. 67 - 40. 710 mis 1. 5s 6:45 m 4. 3 ris - 52.23' - 4.1625 -5.58 7.02 m/s mis 2.0S 8.4m - 7:4 4. 3m /s 8.56 - 59.84 m 7.4 m/S _mis final 10.75? - 10 m 4.3 m/s - 8.6 9. 62 - 63, 430 m/s -Draw the ball's displacement by plotting points (x,y). Connect with a dashed line (trajectory) - At the 1 second location, draw in the Vx, Vy, & v to scale using Icm to represent Im/s of velocity. (0m. 0m) -1 -2 -3 -4 y -5 (m) -6 -7 -8 -9 -10 1 2 3 4 6 7 8 9 10 x (m)
Step by Step Solution
There are 3 Steps involved in it

Get step-by-step solutions from verified subject matter experts