

Question: Can someone please explain this table why are different satistical tests reported?? how do u actually explain the table ie low media exposure 2.15 w
Can someone please explain this table
why are different satistical tests reported??
how do u actually explain the table
ie low media exposure 2.15 w 95%CI (1.98, 2.33) so this means that 2.15% of respondenta wld have hiv test? .. what does the adjusted OR then mean given that it is lower??
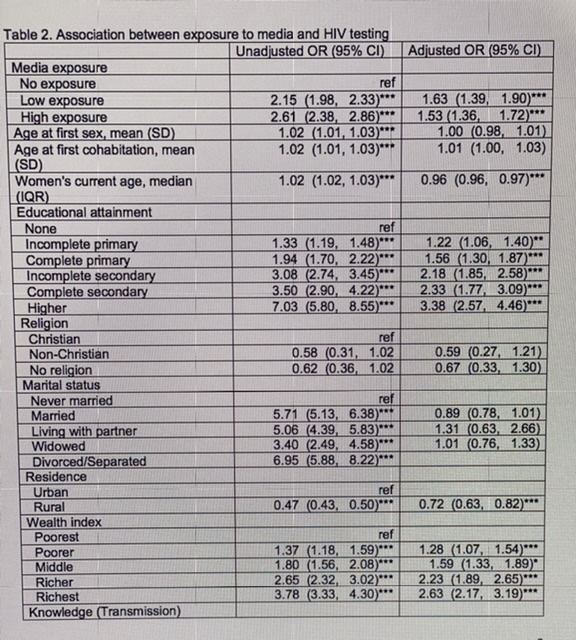
Table 2. Association between exposure to media and HIV testing Unadjusted OR (95% CI) Adjusted OR (95% CI) Media exposure No exposure ref Low exposure 2.15 (1.98, 2.33)"* 1.63 (1.39, 1.90)" High exposure 2.61 (2.38, 2.86)"* 1.53 (1.36, 1.72)"" Age at first sex, mean (SD) 1.02 (1.01, 1.03)" 1.00 (0.98, 1.01) Age at first cohabitation, mean 1.02 (1.01, 1.03)" 1.01 (1.00, 1.03) (SD Women's current age, median 1.02 (1.02, 1.03)" 0.96 (0.96, 0.97)"" (IQR) Educational attainment None ref Incomplete primary 1.33 (1.19, 1.48)"" 1.22 (1.06, 1.40)"" Complete primary 1.94 (1.70, 2.22)""" 1.56 (1.30, 1.87)"" Incomplete secondary 3.08 (2.74, 3.45)""" 2.18 (1.85, 2.58)" Complete secondary 3.50 (2.90, 4.22)"* 2.33 (1.77, 3.09)" Higher 7.03 (5.80, 8.55)*"* 3.38 (2.57, 4.46)""* Religion Christian ref Non-Christian 0.58 (0.31, 1.02 0.59 (0.27, 1.21) No religion 0.62 (0.36, 1.02 0.67 (0.33, 1.30) Marital status Never married ref Married 5.71 (5.13, 6.38)" 0.89 (0.78, 1.01) Living with partner 5.06 (4.39, 5.83)"." 1.31 (0.63, 2.66) Widowed 3.40 (2.49, 4.58)".* 1.01 (0.76, 1.33) Divorced/Separated 6.95 (5.88, 8.22)" Residence Urban ref Rural 0.47 (0.43, 0.50)"" 0.72 (0.63, 0.82)" Wealth index Poorest ref Poorer 1.37 (1.18, 1.59)"" 1.28 (1.07, 1.54)".* Middle 1.80 (1.56, 2.08)."" 1.59 (1.33, 1.89)" Richer 2.65 (2.32, 3.02)"." 2.23 (1.89, 2.65)"" Richest 3.78 (3.33, 4.30)""' 2.63 (2.17, 3.19)""" Knowledge (Transmission)
Step by Step Solution
There are 3 Steps involved in it

Get step-by-step solutions from verified subject matter experts