Question: Can someone please explain this to me using simple terms? I need to make a chart that looks like this but for GoPro. What industries

Can someone please explain this to me using simple terms? I need to make a chart that looks like this but for GoPro. What industries do I use? Where do i get these numbers? I am so lost.Can someone please explain this to me using

TABLE 8.1 Calculating Weighted Industry Attractiveness Scores Rating scale: 1 = Very unattractive to company, 10 = Very attractive to company Importance Industry A Industry B Industry C Industry D Industry Attractiveness Measure Weight Rating/Score Rating/Score Rating/Score Rating/Score Market size and projected growth rate 0.10 8/0.80 5/0.50 2/0.20 3/0.30 Intensity of competition 0.25 8/2.00 7/1.75 3/0.75 2/0.50 Emerging opportunities and threats 0.10 2/0.20 9/0.90 4/0.40 5/0.50 Cross-industry strategic fit 0.20 8/1.60 4/0.80 8/1.60 2/0.40 Resource requirements 0.10 9/0.90 7/0.70 5/0.50 5/0.50 Seasonal and cyclical influences 0.05 9/0.45 8/0.40 10/0.50 5/0.25 Societal, political, regulatory, and environmental factors 0.05 10/0.50 7/0.35 7/0.35 3/0.15 Industry profitability 0.10 5/0.50 10/1.00 3/0.30 3/0.30 Industry uncertainty and business risk 0.05 5/0.25 7/0.35 10/0.50 1/0.05 Sum of the assigned weights 1.00 Overall welghted Industry attractiveness scores 7.20 6.75 5.10 2.95

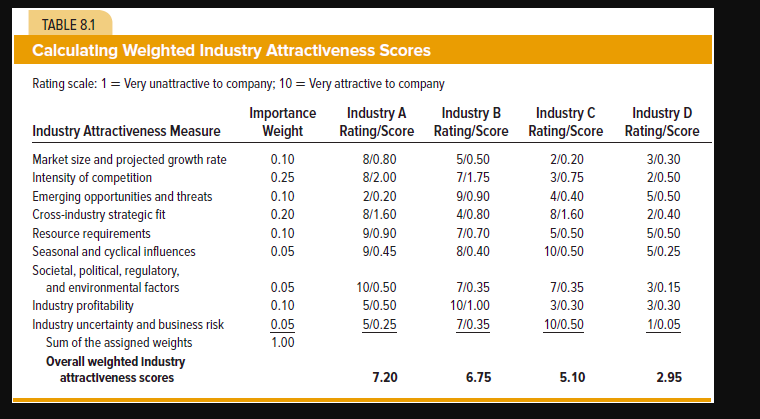
Step by Step Solution

There are 3 Steps involved in it

1 Expert Approved Answer
Step: 1 Unlock blur-text-image
Question Has Been Solved by an Expert!

Get step-by-step solutions from verified subject matter experts

Step: 2 Unlock
Step: 3 Unlock

Students Have Also Explored These Related General Management Questions!