Question: Predicting house prices is a popular exerdse for learning regression analysis. We used one data set in 2020 and serves as the sample assignment. Cne
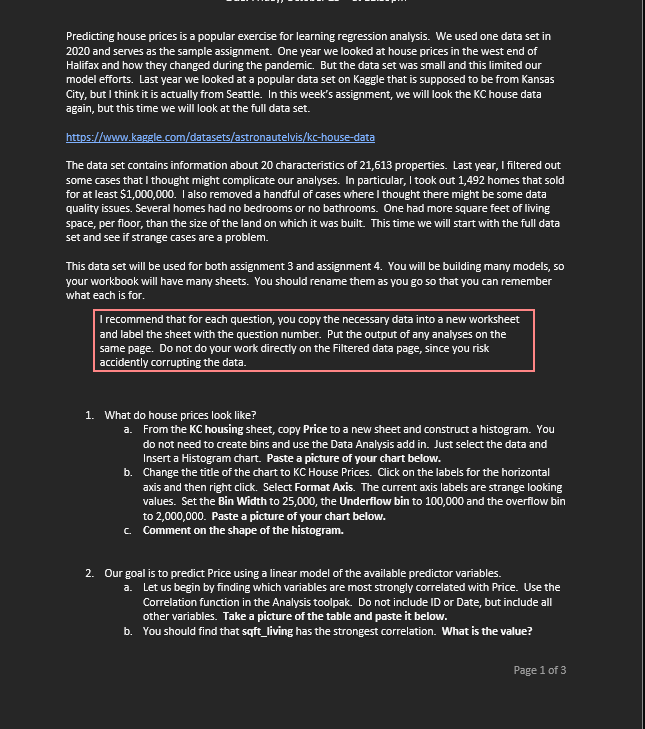
Predicting house prices is a popular exerdse for learning regression analysis. We used one data set in 2020 and serves as the sample assignment. Cne year we looked at house prices in the west end of Halifax and how they changed during the pandemic. But the data set was small and this limited our model efforts. Last year we looked at a popular data set on Kaggle that is supposed to be from Kansas City, but | think it is actually from Seattle. |n this week's assignment, we will look the KC house data again, but this time we will look at the full data set. The data set contains information about 20 characteristics of 21,613 properties. Last year, | filtered out soime cases that | thought might complicate our analyses. In particular, | took out 1,492 homes that sold for at least 51,000,000. | also removed a handful of cases where | thought there might be some data quality issues. Several homes had no bedrooms or no bathrooms. One had more square feet of living space, per floor, than the size of the land on which it was built. This time we will start with the full data set and see if strange cases are a problem. This data set will be used for both assignment 3 and assignment 4. You will be building many models, so your workbook will have many sheets. You should rename them as you go so that you can remember what each is fior. | recommend that for each question, you copy the necessary data into a new worksheet and label the sheet with the guestion number. Put the output of any analyses on the same page. Do not do your work directhy on the Filtered data page, since you risk accidently corrupting the data. 1. What do house prices look like? a. From the KC housing sheet, copy Price to a new sheet and construct a histogram. You do not need to create bins and use the Data Analysis add in. Just select the data and Insert a Histogram chart. Paste a picture of your chart below. Change the title of the chart to KC House Prices. Click on the labels for the horizontal axis and then right click. Select Format Axis. The curment axis |abels are strange looking values. Setthe Bin Width to 25,000, the Underflow bin to 100,000 and the overflow bin to 2,000,000, Paste a picture of your chart below. (o T 1) = R R e R S G 2. Our goal is to predict Price using a linear model of the available predictor variables. a. Letus begin by finding which variables are most strongly correlated with Price. Use the Comrelation function in the Analysis toolpak. Do not include ID or Date, but incdude all other variables. Take a picture of the table and paste it below. You should find that sqft_living has the strongest correlation. What is the value? Let us look at this relationship. Copy sqft_living and price into a new sheet and construct a scatter chart. Label the horizontal axis living space and the vertical axis price. Give the chart a title that is informative. Paste a picture of your chart below. There are several ridiculously large homes. For your information, in Halifax, a small older home is 1,200-1 700 square feet. Typical new homes in Halifax are 2,000-2, 800 square feet. But your chart looks like there are many much larger homes. Construct a histogram for sgft_living. Right dick on the horizontal axis labels and set the bin width to 100, underflow at 300 and overflow at 5000. Relabel the title as \"Living Space\". Paste a picture of your chart below. Comment on what you see in your chart. What are typical home sizes? What do you think about \"tiny homes and \"super homes? Looking back to the chart in Q2c, the pattern slopes upward as expected but it also appears to get wider as living space increases. What are your thoughts on making predictions on house prices with amy model we may construct? 3. Let us build a simple regression model that uses sqft_living to predict price. When filling in the dialog box for Regression, request Residuals and Residual Plot. We will use these in subsequent [+ [T iy h Paste a copy of the first 3 columns of the Summary Output below. In the last table you should be showing the values for Coefficients and Standard Error, but not all the other columns to the right The regression equation is in the form y = b+ mx, but y and x have names. Y is Price and X is sgft living space. Write out the regression equation in words. What is your estimate of the average selling price for a 1,500 sqit home? Within what range would you expect a 1,500 sqft home sell for, 95% of the time? That is what is the lowest price and the highest price that you think such homes would sell for (most of the time)? Let us examine these homes more closely. Select one cell in the KC housing page and Insert a Table. For sqit_living, use the Filter to select those homes with at least 1450 sqft but no more than 1550 sqft. If you insert a Total Row you should find that 1,222 homes meet this description. What is the average price? In the Table you created in O3e, sort the records by price from smallest to largest. The middle 95% would be between the 2.5" percentile [(2.5% smaller) and the 37 5" percentile. This would be approximately the 30 value from the beginning and from the end of the sorted list of prices. What are these values? Are they similar to what you expected in 03d? Construct a histogram of price for these homes that you selected in 03e. Paste a copy of this chart below. Comment on this histogram. 4 Let us try to improve this model. Copy the column of Residuals from the output from Q3a into a new sheet. Remove the filters from KC housing. Copy all of the variables from KC housing, with the exception of the |D and Date columns. a. 1} [ Construct a correlation table for all variables, except Price. Copy this table below. Which 3 variables appear to offer the greatest opportunity for model improvement? You should find that one of these is lat. Lat is the latitude. Construct a scatter chart with Residual on the vertical axis and lat on the horizontal. Paste a copy of this chart 1T Comment on what you see in this chart and whether you think there is truly a relationship between price and whether the home is in the north (high latitude) or the south? Despite any misgivings that you may have in O4d, let us add this variable to our model. Estimate the model price = intercept + coeff1*sqft_living + coeff2*lat. Copy the first 3 columns of the Summary Output below. Write out the regression equation using the values for the intercept and coefficients. What are the new values for the R-square and 5tandard Ermor? Is the model better than the previous one? The coefficient for sgqft_living should not have changed significantly between the 2 models in O3a and Qde. This is because there is not a strong correlation (0.12) between sqft_living and lat, so they contain very different information. Explain what the coefficient for sqft_living represents in terms of the impact of this variable on price
Step by Step Solution
There are 3 Steps involved in it
1 Expert Approved Answer
Step: 1 Unlock
Question Has Been Solved by an Expert!
Get step-by-step solutions from verified subject matter experts
Step: 2 Unlock
Step: 3 Unlock
Students Have Also Explored These Related Mathematics Questions!