

Question: can someone please help me answer this? I am not sure what to do. I have provided the data as well. thanks! begin{tabular}{|l|r|r|r|r|} hline multicolumn{2}{|l|}{
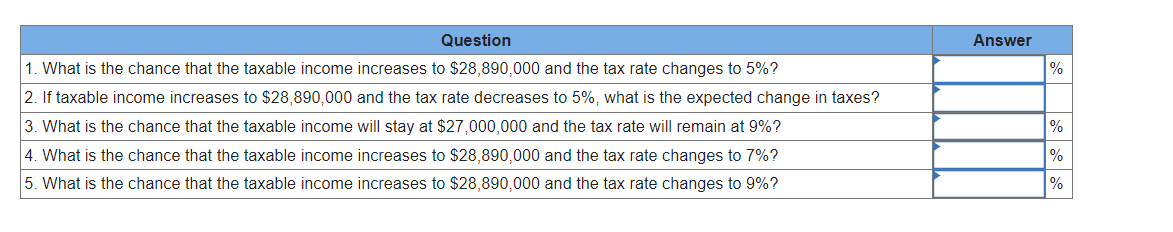
can someone please help me answer this? I am not sure what to do. I have provided the data as well. thanks!
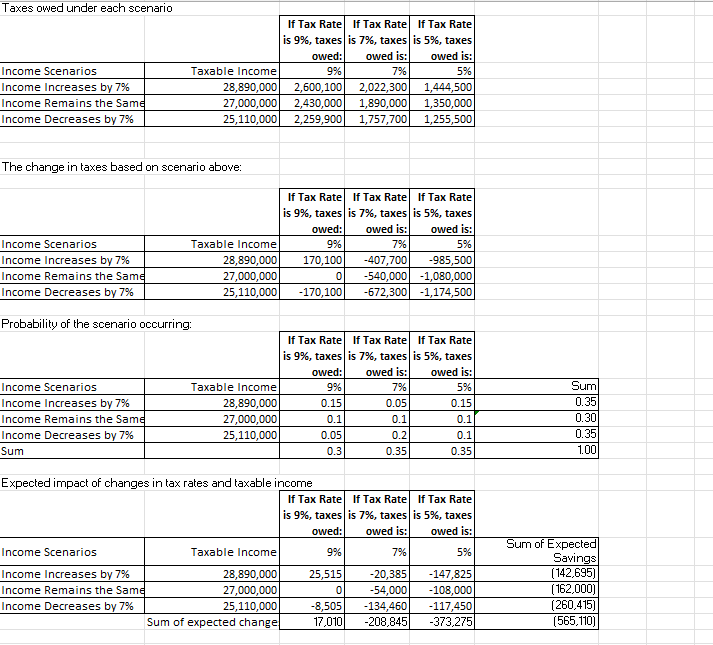
\begin{tabular}{|l|r|r|r|r|} \hline \multicolumn{2}{|l|}{ Taxes owed under each scenario } & \multicolumn{2}{|c|}{} \\ \cline { 3 - 6 } & & \begin{tabular}{r} If Tax Rate \\ is 9%, taxes \\ owed: \end{tabular} & \begin{tabular}{r} If Tax Rate \\ is 7\%, taxes \\ owed is: \\ Is 5%, taxes \\ owed is: \end{tabular} \\ \hline Income Scenarios & Taxable Income & 9% & 7% & 5% \\ \hline Income Increases by 7\% & 28,890,000 & 2,600,100 & 2,022,300 & 1,444,500 \\ \hline Income Remains the Sama & 27,000,000 & 2,430,000 & 1,890,000 & 1,350,000 \\ \hline Income Decreases by 7\% & 25,110,000 & 2,259,900 & 1,757,700 & 1,255,500 \\ \hline \end{tabular} The change in taxes based on scenario above: \begin{tabular}{|l|r|r|r|r|} \cline { 3 - 5 } & & \begin{tabular}{r} If Tax Rate \\ is 9%, taxes \\ owed: \end{tabular} & \begin{tabular}{r} If Tax Rate \\ is 7\%, taxes \\ owed is: \end{tabular} & \begin{tabular}{r} If Tax Rate \\ is 5%, taxes \\ owed is: \end{tabular} \\ \hline Income Scenarios & Taxable Income & 9% & 7% & 5% \\ \hline Income Increases by 7% & 28,890,000 & 170,100 & 407,700 & 985,500 \\ \hline Income Remains the Same & 27,000,000 & 0 & 540,000 & 1,080,000 \\ \hline Income Decreases by 7\% & 25,110,000 & 170,100 & 672,300 & 1,174,500 \\ \hline \end{tabular} Probability of the scenario occurring: \begin{tabular}{|l|r|r|r|r|r|} \cline { 3 - 6 } \multicolumn{2}{l|}{} & \begin{tabular}{r} If Tax Rate \\ is 9%, taxes \\ owed: \end{tabular} & \begin{tabular}{r} If Tax Rate \\ is 7%, taxes \\ owed is: \end{tabular} & \begin{tabular}{r} If Tax Rate \\ is 5\%, taxes \\ owed is: \end{tabular} & \\ \hline Income Scenarios & Taxable Income & 9% & 7% & 5% & Sum \\ \hline Income Increases by 7% & 28,890,000 & 0.15 & 0.05 & 0.15 & 0.35 \\ \hline Income Remains the Same & 27,000,000 & 0.1 & 0.1 & 0.1 & 0.30 \\ \hline Income Decreases by 7\% & 25,110,000 & 0.05 & 0.2 & 0.1 & 0.35 \\ \hline Sum & & 0.3 & 0.35 & 0.35 & 1.00 \\ \hline \end{tabular} Expected impact of changes in tax rates and taxable income \begin{tabular}{|c|c|c|c|c|c|} \hline & & \begin{tabular}{|r|} If Tax Rate \\ is 9%, taxes \\ owed: \\ \end{tabular} & \begin{tabular}{|r|} If Tax Rate \\ is 7%, taxes \\ owed is: \\ \end{tabular} & \begin{tabular}{|r|} If Tax Rate \\ is 5%, taxes \\ owed is: \end{tabular} & \\ \hline Income Scenarios & Taxable Income & 9% & 7% & 5% & \begin{tabular}{r} Sum of Expected \\ Savings \end{tabular} \\ \hline Income Increases by 7% & 28,890,000 & 25,515 & 20,385 & 147,825 & {[142,695)} \\ \hline Income Remains the Same & 27,000,000 & 0 & 54,000 & 108,000 & {[162,000]} \\ \hline Income Decreases by 7\% & 25,110,000 & 8,505 & 134,460 & 117,450 & (260,415) \\ \hline & Sum of expected change & 17,010 & 208,845 & 373,275 & {[565,110]} \\ \hline \end{tabular} \begin{tabular}{|l|r|r|r|r|} \hline \multicolumn{2}{|l|}{ Taxes owed under each scenario } & \multicolumn{2}{|c|}{} \\ \cline { 3 - 6 } & & \begin{tabular}{r} If Tax Rate \\ is 9%, taxes \\ owed: \end{tabular} & \begin{tabular}{r} If Tax Rate \\ is 7\%, taxes \\ owed is: \\ Is 5%, taxes \\ owed is: \end{tabular} \\ \hline Income Scenarios & Taxable Income & 9% & 7% & 5% \\ \hline Income Increases by 7\% & 28,890,000 & 2,600,100 & 2,022,300 & 1,444,500 \\ \hline Income Remains the Sama & 27,000,000 & 2,430,000 & 1,890,000 & 1,350,000 \\ \hline Income Decreases by 7\% & 25,110,000 & 2,259,900 & 1,757,700 & 1,255,500 \\ \hline \end{tabular} The change in taxes based on scenario above: \begin{tabular}{|l|r|r|r|r|} \cline { 3 - 5 } & & \begin{tabular}{r} If Tax Rate \\ is 9%, taxes \\ owed: \end{tabular} & \begin{tabular}{r} If Tax Rate \\ is 7\%, taxes \\ owed is: \end{tabular} & \begin{tabular}{r} If Tax Rate \\ is 5%, taxes \\ owed is: \end{tabular} \\ \hline Income Scenarios & Taxable Income & 9% & 7% & 5% \\ \hline Income Increases by 7% & 28,890,000 & 170,100 & 407,700 & 985,500 \\ \hline Income Remains the Same & 27,000,000 & 0 & 540,000 & 1,080,000 \\ \hline Income Decreases by 7\% & 25,110,000 & 170,100 & 672,300 & 1,174,500 \\ \hline \end{tabular} Probability of the scenario occurring: \begin{tabular}{|l|r|r|r|r|r|} \cline { 3 - 6 } \multicolumn{2}{l|}{} & \begin{tabular}{r} If Tax Rate \\ is 9%, taxes \\ owed: \end{tabular} & \begin{tabular}{r} If Tax Rate \\ is 7%, taxes \\ owed is: \end{tabular} & \begin{tabular}{r} If Tax Rate \\ is 5\%, taxes \\ owed is: \end{tabular} & \\ \hline Income Scenarios & Taxable Income & 9% & 7% & 5% & Sum \\ \hline Income Increases by 7% & 28,890,000 & 0.15 & 0.05 & 0.15 & 0.35 \\ \hline Income Remains the Same & 27,000,000 & 0.1 & 0.1 & 0.1 & 0.30 \\ \hline Income Decreases by 7\% & 25,110,000 & 0.05 & 0.2 & 0.1 & 0.35 \\ \hline Sum & & 0.3 & 0.35 & 0.35 & 1.00 \\ \hline \end{tabular} Expected impact of changes in tax rates and taxable income \begin{tabular}{|c|c|c|c|c|c|} \hline & & \begin{tabular}{|r|} If Tax Rate \\ is 9%, taxes \\ owed: \\ \end{tabular} & \begin{tabular}{|r|} If Tax Rate \\ is 7%, taxes \\ owed is: \\ \end{tabular} & \begin{tabular}{|r|} If Tax Rate \\ is 5%, taxes \\ owed is: \end{tabular} & \\ \hline Income Scenarios & Taxable Income & 9% & 7% & 5% & \begin{tabular}{r} Sum of Expected \\ Savings \end{tabular} \\ \hline Income Increases by 7% & 28,890,000 & 25,515 & 20,385 & 147,825 & {[142,695)} \\ \hline Income Remains the Same & 27,000,000 & 0 & 54,000 & 108,000 & {[162,000]} \\ \hline Income Decreases by 7\% & 25,110,000 & 8,505 & 134,460 & 117,450 & (260,415) \\ \hline & Sum of expected change & 17,010 & 208,845 & 373,275 & {[565,110]} \\ \hline \end{tabular}
Step by Step Solution
There are 3 Steps involved in it

Get step-by-step solutions from verified subject matter experts