

Question: Can someone please help me find the missing K values for Table 3 and how to create the graph? Thanks! Solution A: 50 ml [KIO3]
Can someone please help me find the missing "K" values for Table 3 and how to create the graph? Thanks!
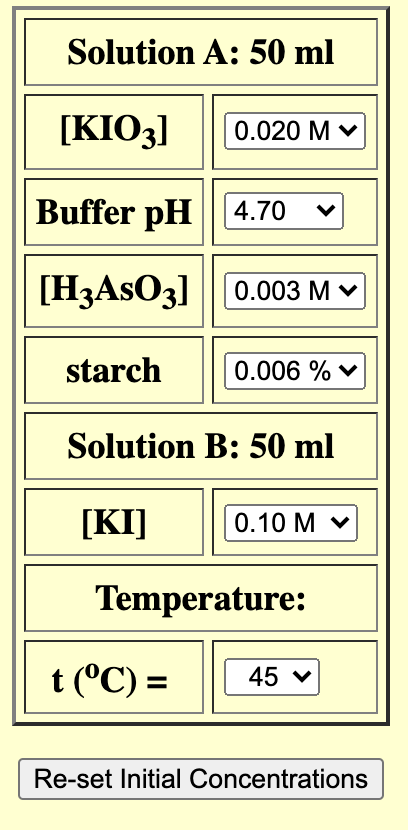
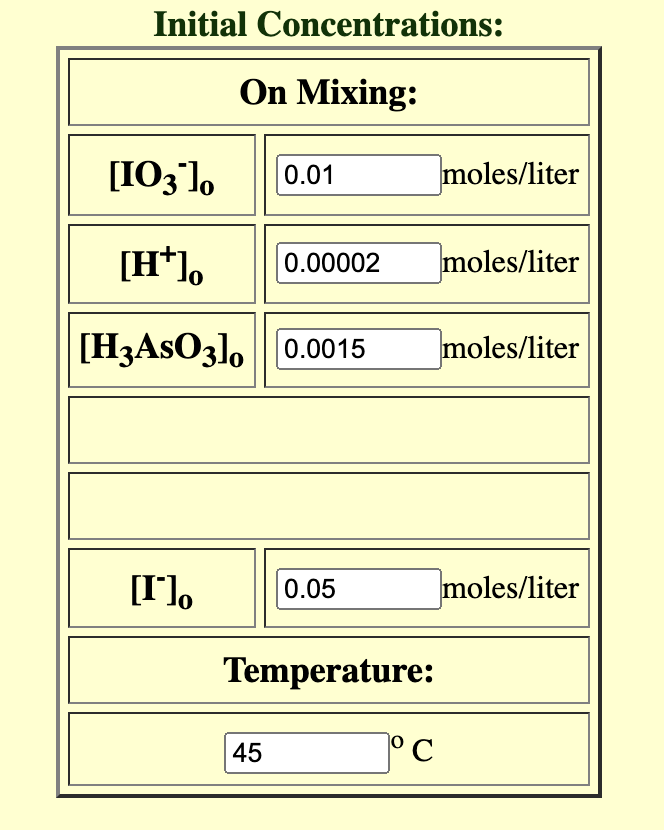
![[KIO3] 0.020 Mv Buffer pH 4.70 [H3AsO3] 0.003 M V starch 0.006](https://dsd5zvtm8ll6.cloudfront.net/si.experts.images/questions/2024/09/66f91b97e74d2_55966f91b9774636.jpg)
Solution A: 50 ml [KIO3] 0.020 Mv Buffer pH 4.70 [H3AsO3] 0.003 M V starch 0.006 % v Solution B: 50 ml [KI] 0.10 Mv Temperature: t(C) = = 45 v Re-set Initial Concentrations Initial Concentrations: On Mixing: [103 1. 0.01 moles/liter [H). 0.00002 moles/liter [H3AsO3], 0.0015 moles/liter [l lo 0.05 moles/liter Temperature: 45 1 C lodine Clock Reaction [H]. (M) Time (s) . 0.10 Data Sheet: Part 1: Effect of Concentration Data (10 points) Table 1. Raw experimental data. Run # (M)[K10;] [K!] (M) (M) (ID, 1, [1]. (M) 0.010 0.10 0.005 0.05 2 0.020 0-01 0.05 0.010 0.20 0.005 0.10 4 0.010 0.10 0.05 (10 points) Table 2. Calculated individual orders and rate constant. Overall b k order 1 2 2 5 7.12 x 10⁴ (5 points) Rate Law: Part 2: Effect of temperature Data rate= K (10,1C1*3* CH*]? 0.00002 0.00002 0.00002 0.00004 11.4 8.6 4.7 4.4 0.00 5 a K units 1/(m.s) Keevin? 3.45 x 16-4 7.19*10-4 2.13 X ID-4 (10 points) Table 3. Data for the effect of temperature experiment. Run # T(C) tc (s) Rate (M/s) ka (1/T) (K-1) Ln(K) 1 5.0 58 15.0 22 9.05x10⁻⁴ 25.0 9 2-2 2x10⁻³ 1.34 X1D-4 4 35.0 4 5-26 X 10 -3 9.28x10.5 5 45.0 4.52 x 10⁻³ 6.99 XID 5 1) (10 points) Plot the linear version of the Arrhenius equation based on your experimental results, using a graphing software like MS Excel or Google Sheets. I nsert your graph here. 2 3 2 2) (5 points) Obtain the equation for the plot above and derive the following values from such equation. Table 4. Results extracted from the Arrhenius plot. A Slope Ea (J/mol) 4
Step by Step Solution
There are 3 Steps involved in it

Get step-by-step solutions from verified subject matter experts