

Question: Can someone please help me out with this question Comparative financial statement data for Pharoah Company and Sunland Company, two competitors, appear below. All balance
Can someone please help me out with this question
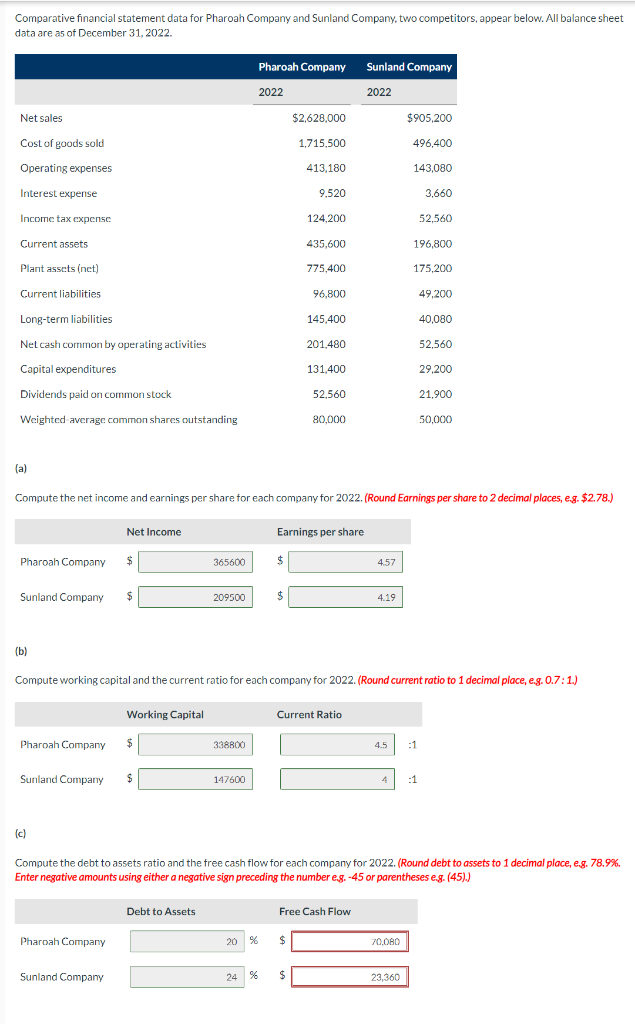
Comparative financial statement data for Pharoah Company and Sunland Company, two competitors, appear below. All balance sheet data are as of December 31, 2022. Pharoah Company Sunland Company 2022 2022 Net sales $2,628,000 $905,200 Cost of goods sold 1.715,500 496,400 Operating expenses 413.180 143,080 Interest expense 9.520 3,660 Income tax expense 124.200 52,560 435,600 196,800 Current assets Plant assets (net) Current liabilities 775,400 175.200 96,800 49,200 Long-term liabilities 145,400 40,080 Nel cash common by operating activities 201.480 52,560 Capital expenditures 131,400 29,200 Dividends paid on common stock 52.560 21,900 Weighted average common shares outstanding 80,000 50,000 (a) Compute the net income and earnings per share for each company for 2022. (Round Earnings per share to 2 decimal places, eg. $2.78.) Net Income Earnings per share Pharoah Company $ 365600 $ 457 Sunland Company $ 209500 $ 4.19 (b) Compute working capital and the current ratio for each company for 2022. (Round current ratio to 1 decimal place, eg. 0.7:1) Working Capital Current Ratio Pharoah Company $ 338800 4.5 :1 Sunland Company $ 147600 4 4 :1 (c) Compute the debt to assets ratio and the free cash flow for each company for 2022. (Round debt to assets to 1 decimal place, e.g. 78.9%. Enter negative amounts using either a negative sign preceding the number eg.-45 or parentheses e.g. (45).) Debt to Assets Free Cash Flow Pharoah Company 20 % $ 70.000 Sunland Company 24 % $ 23,360
Step by Step Solution
There are 3 Steps involved in it

Get step-by-step solutions from verified subject matter experts