

Question: Here are comparative statement data for Pharoah Company and Cullumber Company, two competitors. All balance sheet data are as of December 31, 2022, and December
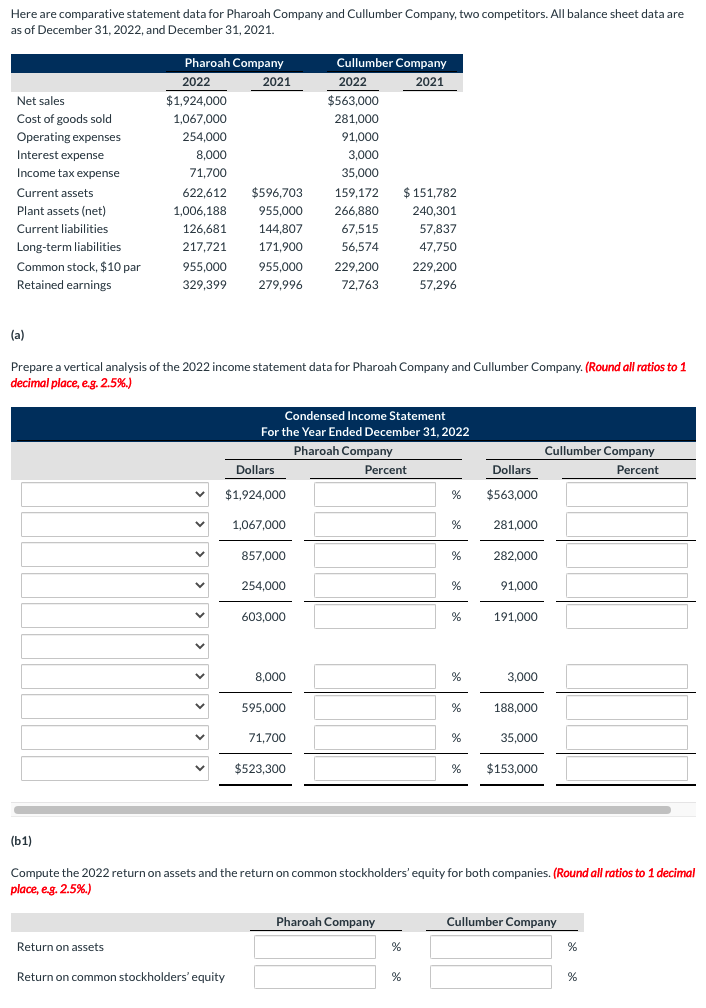
Here are comparative statement data for Pharoah Company and Cullumber Company, two competitors. All balance sheet data are as of December 31, 2022, and December 31, 2021. Net sales Cost of goods sold Operating expenses Interest expense Income tax expense Current assets Plant assets (net) Current liabilities Long-term liabilities Common stock, $10 par Retained earnings Pharoah Company 2022 2021 $1,924,000 1,067,000 254,000 8,000 71,700 622,612 $596,703 1,006,188 955,000 126,681 144,807 217,721 171.900 955,000 955,000 329,399 279,996 Cullumber Company 2022 2021 $563,000 281,000 91,000 3,000 35,000 159,172 $ 151,782 266,880 240,301 67,515 57,837 56,574 47.750 229,200 229,200 72,763 57,296 (a) Prepare a vertical analysis of the 2022 income statement data for Pharoah Company and Cullumber Company. (Round all ratios to 1 decimal place, e.g. 2.5%) Condensed Income Statement For the Year Ended December 31, 2022 Pharoah Company Dollars Percent Cullumber Company Percent Dollars $1,924,000 % $563,000 1,067,000 % 281,000 857,000 % 282,000 254,000 % 91,000 603,000 % % 191,000 8,000 % 3,000 595,000 % 188,000 71,700 % 35,000 $523,300 % $153,000 (61) Compute the 2022 return on assets and the return on common stockholders' equity for both companies. (Round all ratios to 1 decimal place, e.g. 2.5%) Pharoah Company Cullumber Company Return on assets % % Return on common stockholders' equity % %
Step by Step Solution
There are 3 Steps involved in it

Get step-by-step solutions from verified subject matter experts