

Question: Can someone please help me with explaining the correlation shown in the image below. What is it's direction and strength? What does this tell show?
Can someone please help me with explaining the correlation shown in the image below. What is it's direction and strength? What does this tell show?
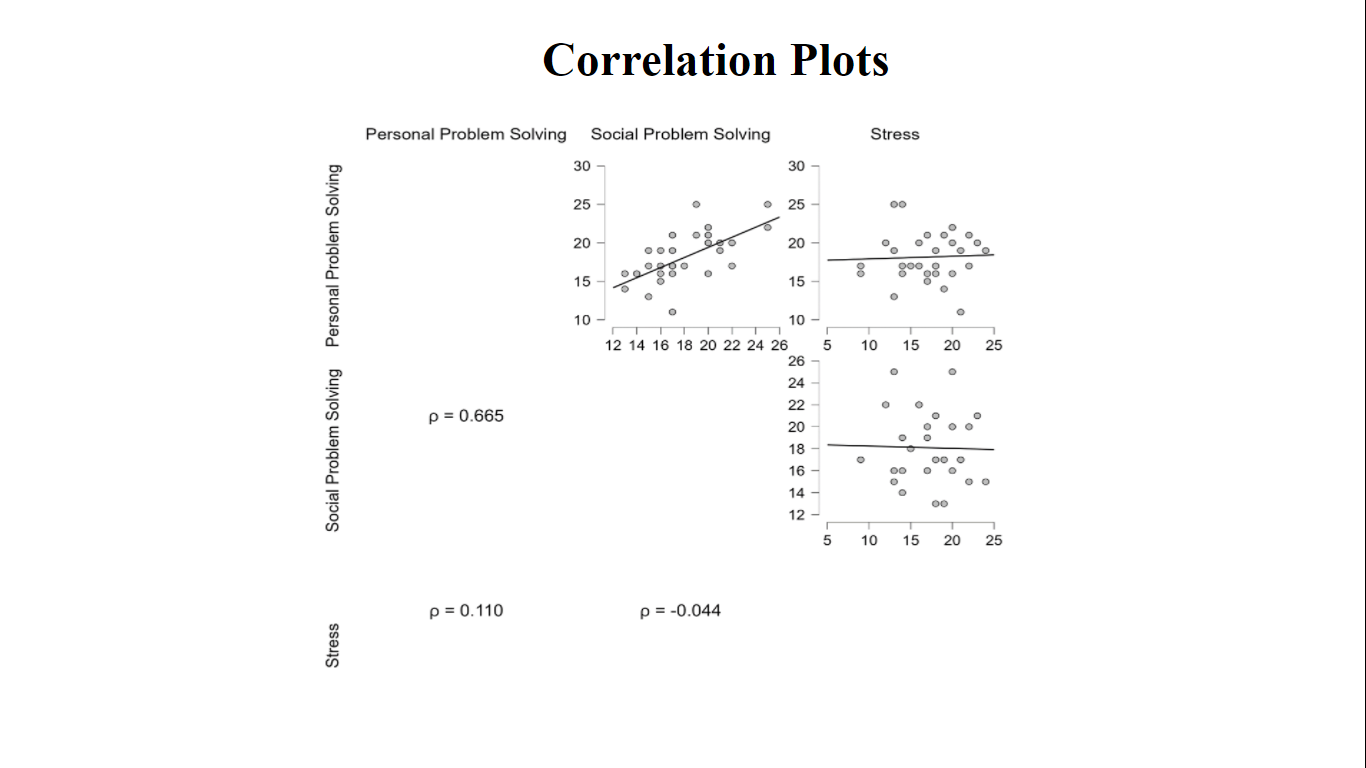
Correlation Plots Personal Problem Solving Social Problem Solving Stress 30 - 30 25 25 20 20 15 15 10 10 Social Problem Solving Personal Problem Solving 12 14 16 18 20 22 24 26 5 10 15 20 25 26 24 P = 0.665 22 20 18 00 0 16 DO 14 12 5 10 15 20 25 p = 0. 110 p = -0.044 Stress
Step by Step Solution
There are 3 Steps involved in it
1 Expert Approved Answer
Step: 1 Unlock

Question Has Been Solved by an Expert!
Get step-by-step solutions from verified subject matter experts
Step: 2 Unlock
Step: 3 Unlock