

Question: Can someone please help me with this (. use the command hold on to plot multiple figures in the same window) ?? It is general
Can someone please help me with this (. use the command hold on to plot multiple figures in the same window) ??
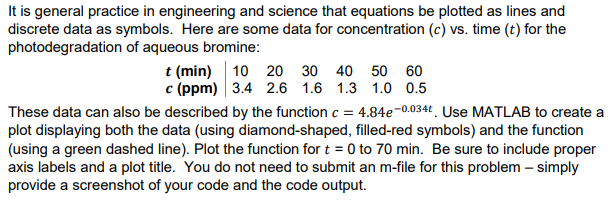
It is general practice in engineering and science that equations be plotted as lines and discrete data as symbols. Here are some data for concentration (c) vs. time (t) for the photodegradation of aqueous bromine: t (min) 10 20 30 40 50 60 c (ppm) 3.4 2.6 1.6 1.3 1.0 0.5 These data can also be described by the function c = 4.84e-0.034t. Use MATLAB to create a plot displaying both the data (using diamond-shaped, filled-red symbols) and the function (using a green dashed line). Plot the function for t = 0 to 70 min. Be sure to include proper axis labels and a plot title. You do not need to submit an m-file for this problem - simply provide a screenshot of your code and the code output
Step by Step Solution
There are 3 Steps involved in it

Get step-by-step solutions from verified subject matter experts