

Question: can someone please plot this using matplotlib #step 3 code and testing def simSatelliteWithThrust (initialvelocity, totalTime, timeStep, thrustForce) : elapsedTime=[0] velocity=[initialvelocity] thruster_Time= 27 thruster_Fire= 1.3
can someone please plot this using matplotlib
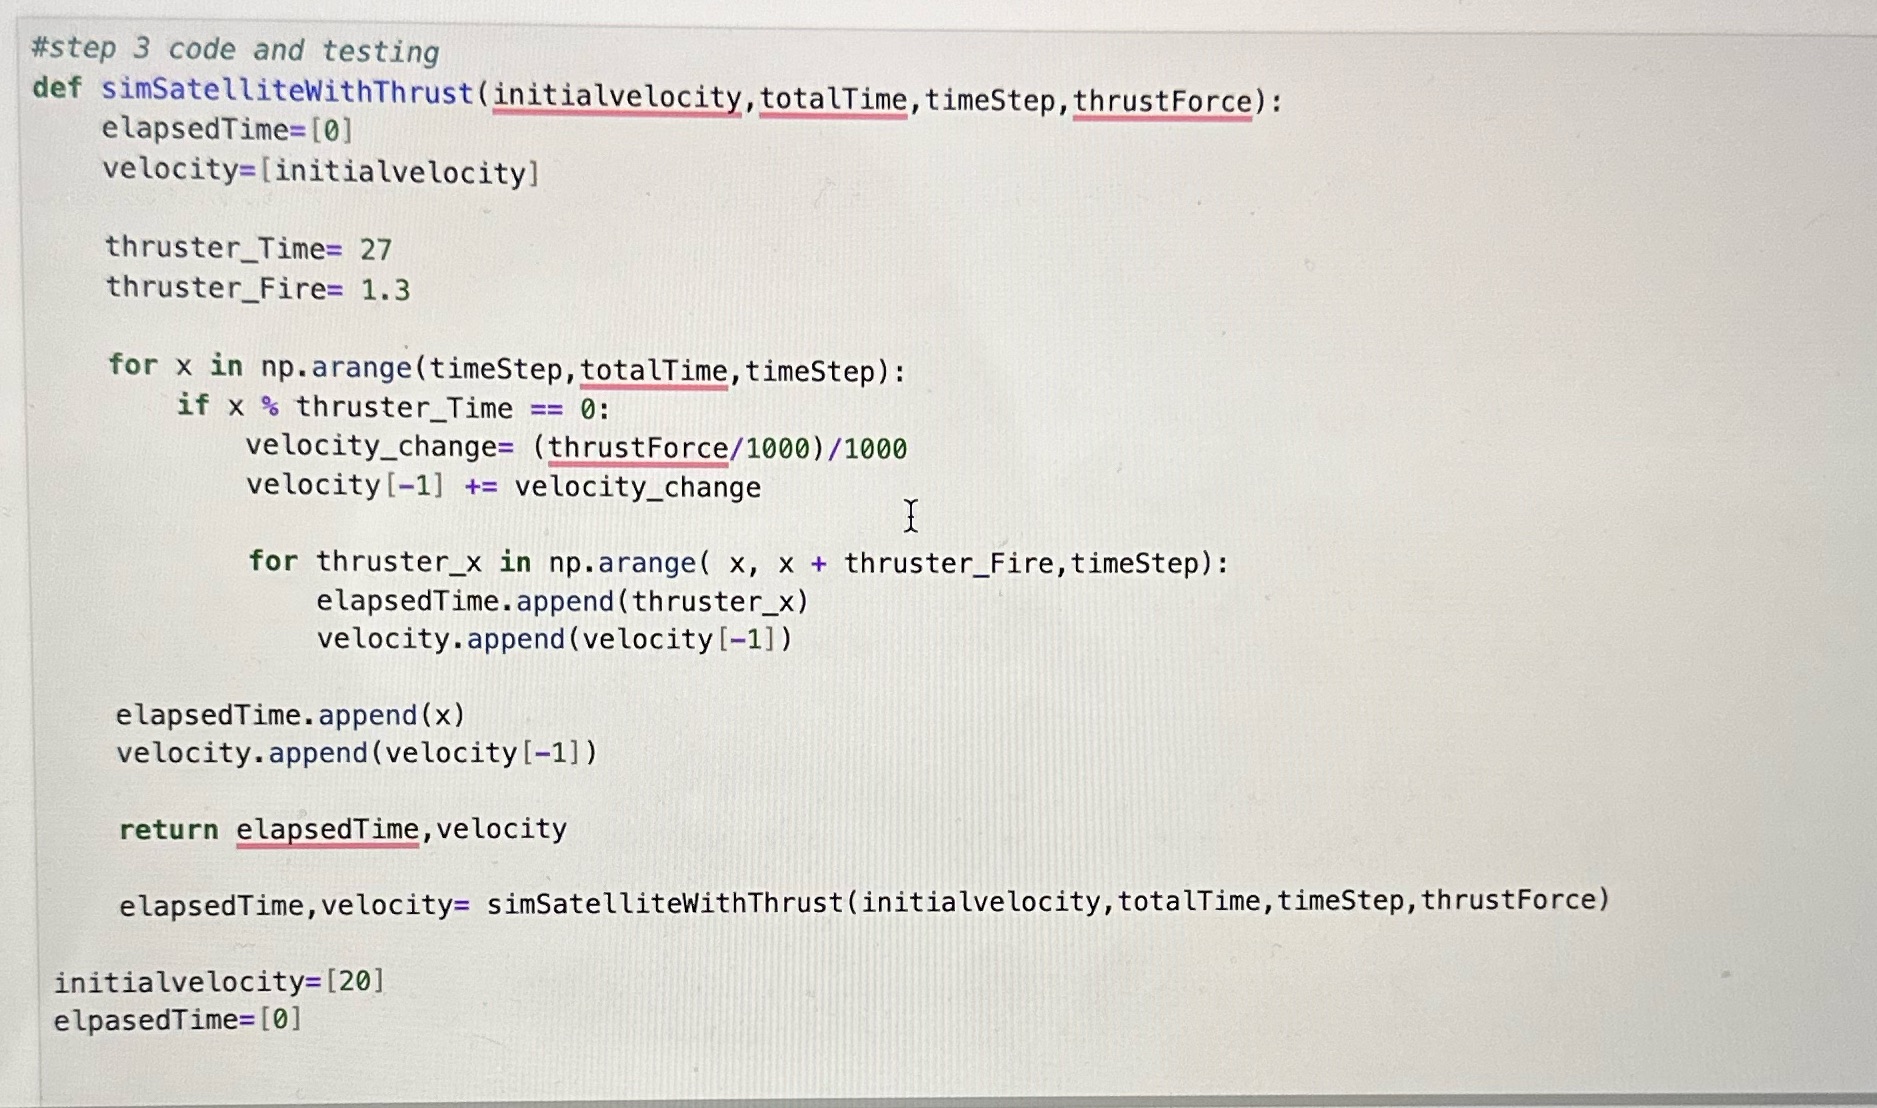
#step 3 code and testing def simSatelliteWithThrust (initialvelocity, totalTime, timeStep, thrustForce) : elapsedTime=[0] velocity=[initialvelocity] thruster_Time= 27 thruster_Fire= 1.3 for x in np. arange ( timeStep, totalTime, timeStep) : if x % thruster_Time == 0: velocity_change= (thrustForce/1000) /1000 velocity [-1] += velocity_change I for thruster_x in np. arange( x, x + thruster_Fire, timeStep) : elapsedTime . append ( thruster_x) velocity . append ( velocity [-1] ) elapsedTime . append (x) velocity . append ( velocity [-1] ) return elapsedTime, velocity elapsedTime, velocity= simSatelliteWithThrust(initialvelocity, totalTime, timeStep, thrustForce) initialvelocity=[20] elpasedTime= [0]
Step by Step Solution
There are 3 Steps involved in it

Get step-by-step solutions from verified subject matter experts