

Question: Can someone please show me how to solve this problem? I'm really lost and struggling with it! Whoever provides me with the best answer is
Can someone please show me how to solve this problem? I'm really lost and struggling with it! Whoever provides me with the best answer is guaranteed a Thumbs Up :)
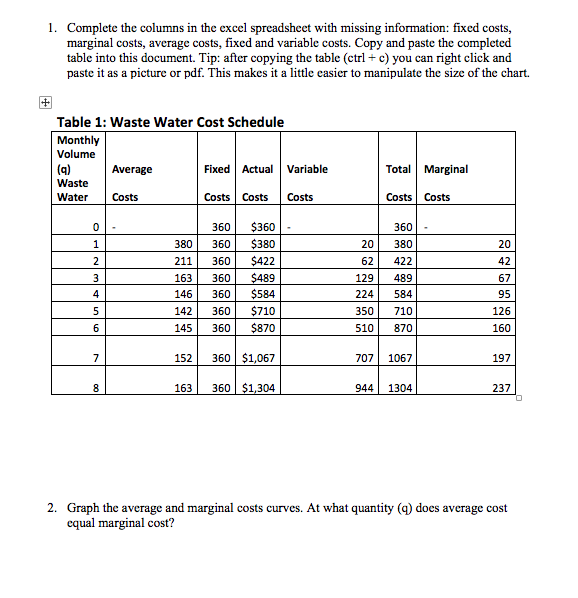
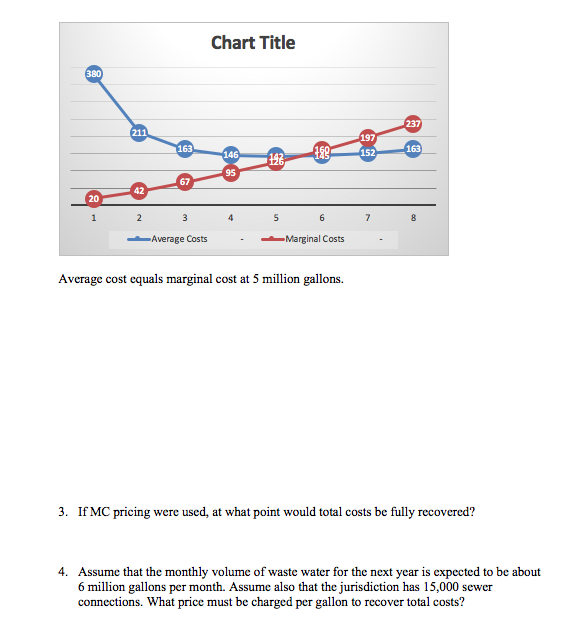
1. Complete the columns in the excel spreadsheet with missing information: fixed costs, marginal costs, average costs, fixed and variable costs. Copy and paste the completed table into this document. Tip: after copying the table (ctrl + c) you can right click and paste it as a picture or pdf. This makes it a little easier to manipulate the size of the chart. Table 1: Waste Water Cost Schedule Monthly Volume (q) Average Fixed Actual Variable Waste Water Costs Costs Costs Costs Total Marginal Costs Costs 20 380 211 163 146 142 145 360 360 360 360 360 360 360 $360 $380 $422 $489 $584 $710 $870 129 224 350 510 360 380 422 489 584 710 870 152 707 1067 360 $1,067 360 $1,304 360 $1,304 L 1 63 344 1304 2. Graph the average and marginal costs curves. At what quantity (9) does average cost equal marginal cost? Chart Title 0 2 4 7 8 3 Average Costs 5 6 Marginal Costs - Average cost equals marginal cost at 5 million gallons. 3. If MC pricing were used, at what point would total costs be fully recovered? 4. Assume that the monthly volume of waste water for the next year is expected to be about 6 million gallons per month. Assume also that the jurisdiction has 15,000 sewer connections. What price must be charged per gallon to recover total costs? 1. Complete the columns in the excel spreadsheet with missing information: fixed costs, marginal costs, average costs, fixed and variable costs. Copy and paste the completed table into this document. Tip: after copying the table (ctrl + c) you can right click and paste it as a picture or pdf. This makes it a little easier to manipulate the size of the chart. Table 1: Waste Water Cost Schedule Monthly Volume (q) Average Fixed Actual Variable Waste Water Costs Costs Costs Costs Total Marginal Costs Costs 20 380 211 163 146 142 145 360 360 360 360 360 360 360 $360 $380 $422 $489 $584 $710 $870 129 224 350 510 360 380 422 489 584 710 870 152 707 1067 360 $1,067 360 $1,304 360 $1,304 L 1 63 344 1304 2. Graph the average and marginal costs curves. At what quantity (9) does average cost equal marginal cost? Chart Title 0 2 4 7 8 3 Average Costs 5 6 Marginal Costs - Average cost equals marginal cost at 5 million gallons. 3. If MC pricing were used, at what point would total costs be fully recovered? 4. Assume that the monthly volume of waste water for the next year is expected to be about 6 million gallons per month. Assume also that the jurisdiction has 15,000 sewer connections. What price must be charged per gallon to recover total costs
Step by Step Solution
There are 3 Steps involved in it

Get step-by-step solutions from verified subject matter experts