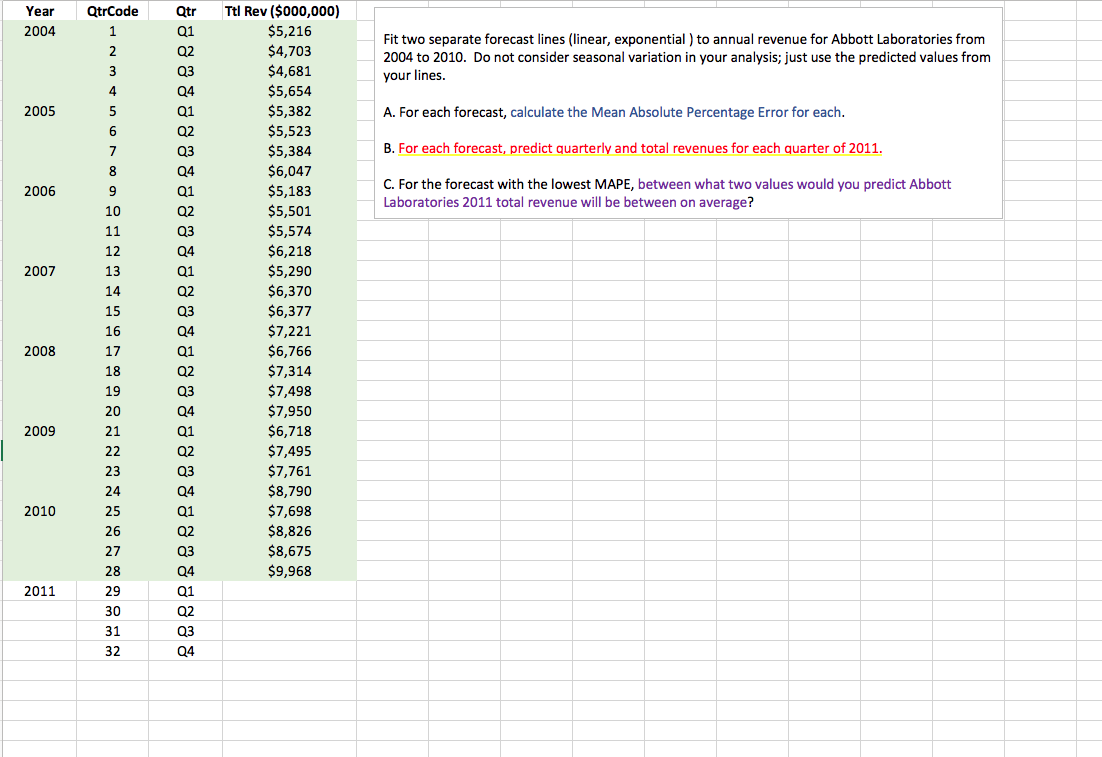
Question: Can someone please show me how to solve this problem? I'm really lost and struggling with it! Whoever provides me with the best answer is

Can someone please show me how to solve this problem? I'm really lost and struggling with it! Whoever provides me with the best answer is guaranteed a Thumbs Up :)

Can someone please show me how to solve this

QtrCode Year 2004 Fit two separate forecast lines (linear, exponential) to annual revenue for Abbott Laboratories from 2004 to 2010. Do not consider seasonal variation in your analysis; just use the predicted values from your lines. 2005 A. For each forecast, calculate the Mean Absolute Percentage Error for each. B. For each forecast, predict quarterly and total revenues for each quarter of 2011. 2006 C. For the forecast with the lowest MAPE, between what two values would you predict Abbott Laboratories 2011 total revenue will be between on average? 2007 Ttl Rev ($000,000) $5,216 $4,703 $4,681 $5,654 $5,382 $5,523 $5,384 $6,047 $5,183 $5,501 $5,574 $6,218 $5,290 $6,370 $6,377 $7,221 $6,766 $7,314 $7,498 $7,950 $6,718 $ 7,495 $7,761 $8,790 $7,698 $8,826 $8,675 $9,968 2008 2009 2010 2011

Step by Step Solution

There are 3 Steps involved in it

1 Expert Approved Answer
Step: 1 Unlock blur-text-image
Question Has Been Solved by an Expert!

Get step-by-step solutions from verified subject matter experts

Step: 2 Unlock
Step: 3 Unlock

Students Have Also Explored These Related General Management Questions!