

Question: can u apply mixed strategy to find the total cost( have applied level and chase strategies i need mixed strategy solution to find which strategy
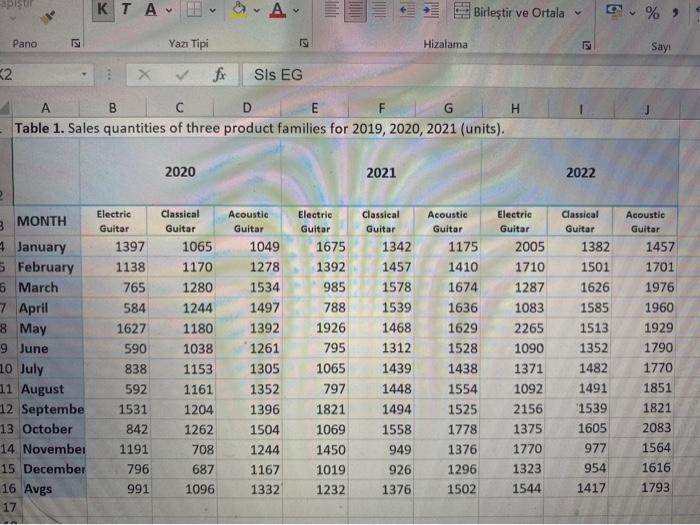
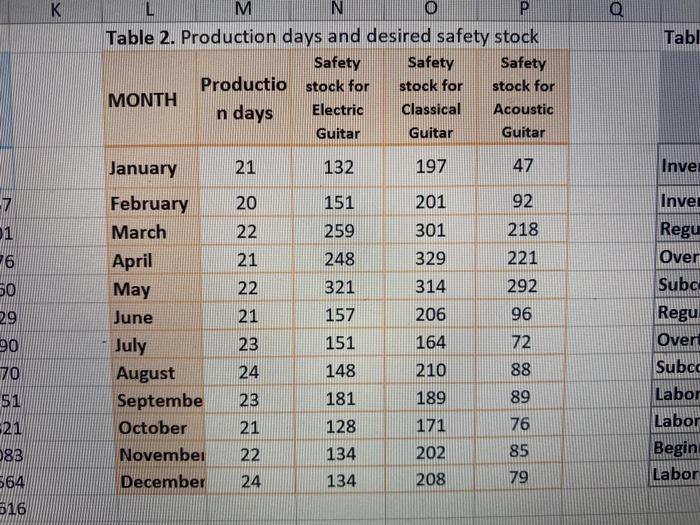
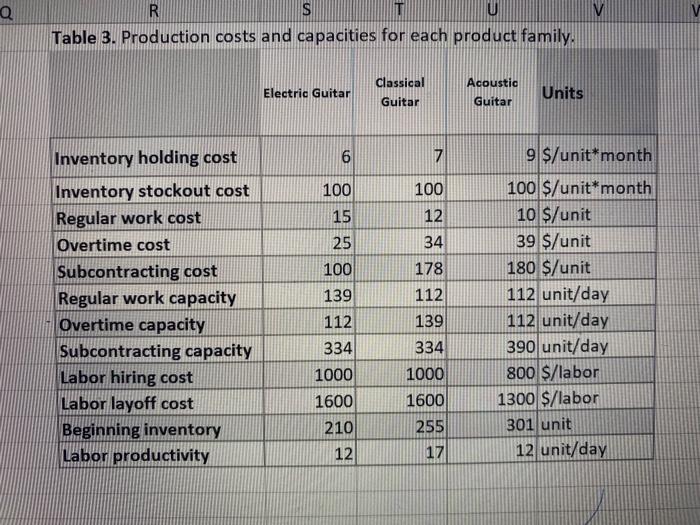
Table 1. Sales quantities of three product families for 2019, 2020, 2021 (units). \begin{tabular}{|c|c|c|c|c|c|c|c|c|c|} \hline MONTH & \begin{tabular}{c} Electric \\ Guitar \end{tabular} & \begin{tabular}{c} Classical \\ Guitar \end{tabular} & \begin{tabular}{c} Acoustic \\ Guitar \end{tabular} & \begin{tabular}{c} Electrie \\ Guitar \end{tabular} & \begin{tabular}{c} Classical \\ Guitar \end{tabular} & \begin{tabular}{c} Acoustic \\ Guitar \end{tabular} & \begin{tabular}{l} Electric \\ Guitar \end{tabular} & \begin{tabular}{l} Classical \\ Guitar \end{tabular} & \begin{tabular}{c} Acoustic \\ Guitar \end{tabular} \\ \hline January & 1397 & 1065 & 1049 & 1675 & 1342 & 1175 & 2005 & 1382 & 1457 \\ \hline February & 1138 & 1170 & 1278 & 1392 & 1457 & 1410 & 1710 & 1501 & 1701 \\ \hline March & 765 & 1280 & 1534 & 985 & 1578 & 1674 & 1287 & 1626 & 1976 \\ \hline April & 584 & 1244 & 1497 & 788 & 1539 & 1636 & 1083 & 1585 & 1960 \\ \hline May & 1627 & 1180 & 1392 & 1926 & 1468 & 1629 & 2265 & 1513 & 1929 \\ \hline June & 590 & 1038 & 1261 & 795 & 1312 & 1528 & 1090 & 1352 & 1790 \\ \hline July & 838 & 1153 & 1305 & 1065 & 1439 & 1438 & 1371 & 1482 & 1770 \\ \hline August & 592 & 1161 & 1352 & 797 & 1448 & 1554 & 1092 & 1491 & 1851 \\ \hline Septembe & 1531 & 1204 & 1396 & 1821 & 1494 & 1525 & 2156 & 1539 & 1821 \\ \hline October & 842 & 1262 & 1504 & 1069 & 1558 & 1778 & 1375 & 1605 & 2083 \\ \hline Novembei & 1191 & 708 & 1244 & 1450 & 949 & 1376 & 1770 & 977 & 1564 \\ \hline December & 796 & 687 & 1167 & 1019 & 926 & 1296 & 1323 & 954 & 1616 \\ \hline Avgs & 991 & 1096 & 1332 & 1232 & 1376 & 1502 & 1544 & 1417 & 1793 \\ \hline \end{tabular} Table 2. Production days and desired safety stock \begin{tabular}{|l|c|c|c|c|} \hline MONTH & \begin{tabular}{c} Productio \\ n days \end{tabular} & \begin{tabular}{c} Safety \\ stock for \\ Electric \\ Guitar \end{tabular} & \begin{tabular}{c} Safety \\ stock for \\ Classical \\ Guitar \end{tabular} & \begin{tabular}{c} Safety \\ stock for \\ Acoustic \\ Guitar \end{tabular} \\ \hline January & 21 & 132 & 197 & 47 \\ \hline February & 20 & 151 & 201 & 92 \\ \hline March & 22 & 259 & 301 & 218 \\ \hline April & 21 & 248 & 329 & 221 \\ \hline May & 22 & 321 & 314 & 292 \\ \hline June & 21 & 157 & 206 & 96 \\ \hline July & 23 & 151 & 164 & 72 \\ \hline August & 24 & 148 & 210 & 88 \\ \hline Septembe & 23 & 181 & 189 & 89 \\ \hline \begin{tabular}{l} October \\ November \end{tabular} & 21 & 128 & 171 & 76 \\ \hline December & 24 & 134 & 202 & 85 \\ \hline \end{tabular} Table 3. Production costs and capacities for each product family. \begin{tabular}{|c|c|c|c|c|} \hline & Electric Guitar & \begin{tabular}{c} Classical \\ Guitar \end{tabular} & \begin{tabular}{c} Acoustic \\ Guitar \end{tabular} & Units \\ \hline Inventory holding cost & 6 & 7 & 9 & $ /unit*month \\ \hline Inventory stockout cost & 100 & 100 & 100 & \$/unit*month \\ \hline Regular work cost & 15 & 12 & 10 & \$/unit \\ \hline Overtime cost & 25 & 34 & 39 & $/ unit \\ \hline Subcontracting cost & 100 & 178 & 180 & \$/unit \\ \hline Regular work capacity & 139 & 112 & 112 & unit/day \\ \hline Overtime capacity & 112 & 139 & 112 & unit/day \\ \hline Subcontracting capacity & 334 & 334 & 390 & unit/day \\ \hline Labor hiring cost & 1000 & 1000 & 800 & $/labor \\ \hline Labor layoff cost & 1600 & 1600 & 1300 & $/labor \\ \hline Beginning inventory & 210 & 255 & 301 & unit \\ \hline Labor productivity & 12 & 17 & 12 & unit/day \\ \hline \end{tabular}
Step by Step Solution
There are 3 Steps involved in it

Get step-by-step solutions from verified subject matter experts