

Question: Can you answer all the questions please PART III - Final Model Interpretations - Answer the following questions about your best model. Least Squares Linear
Can you answer all the questions please
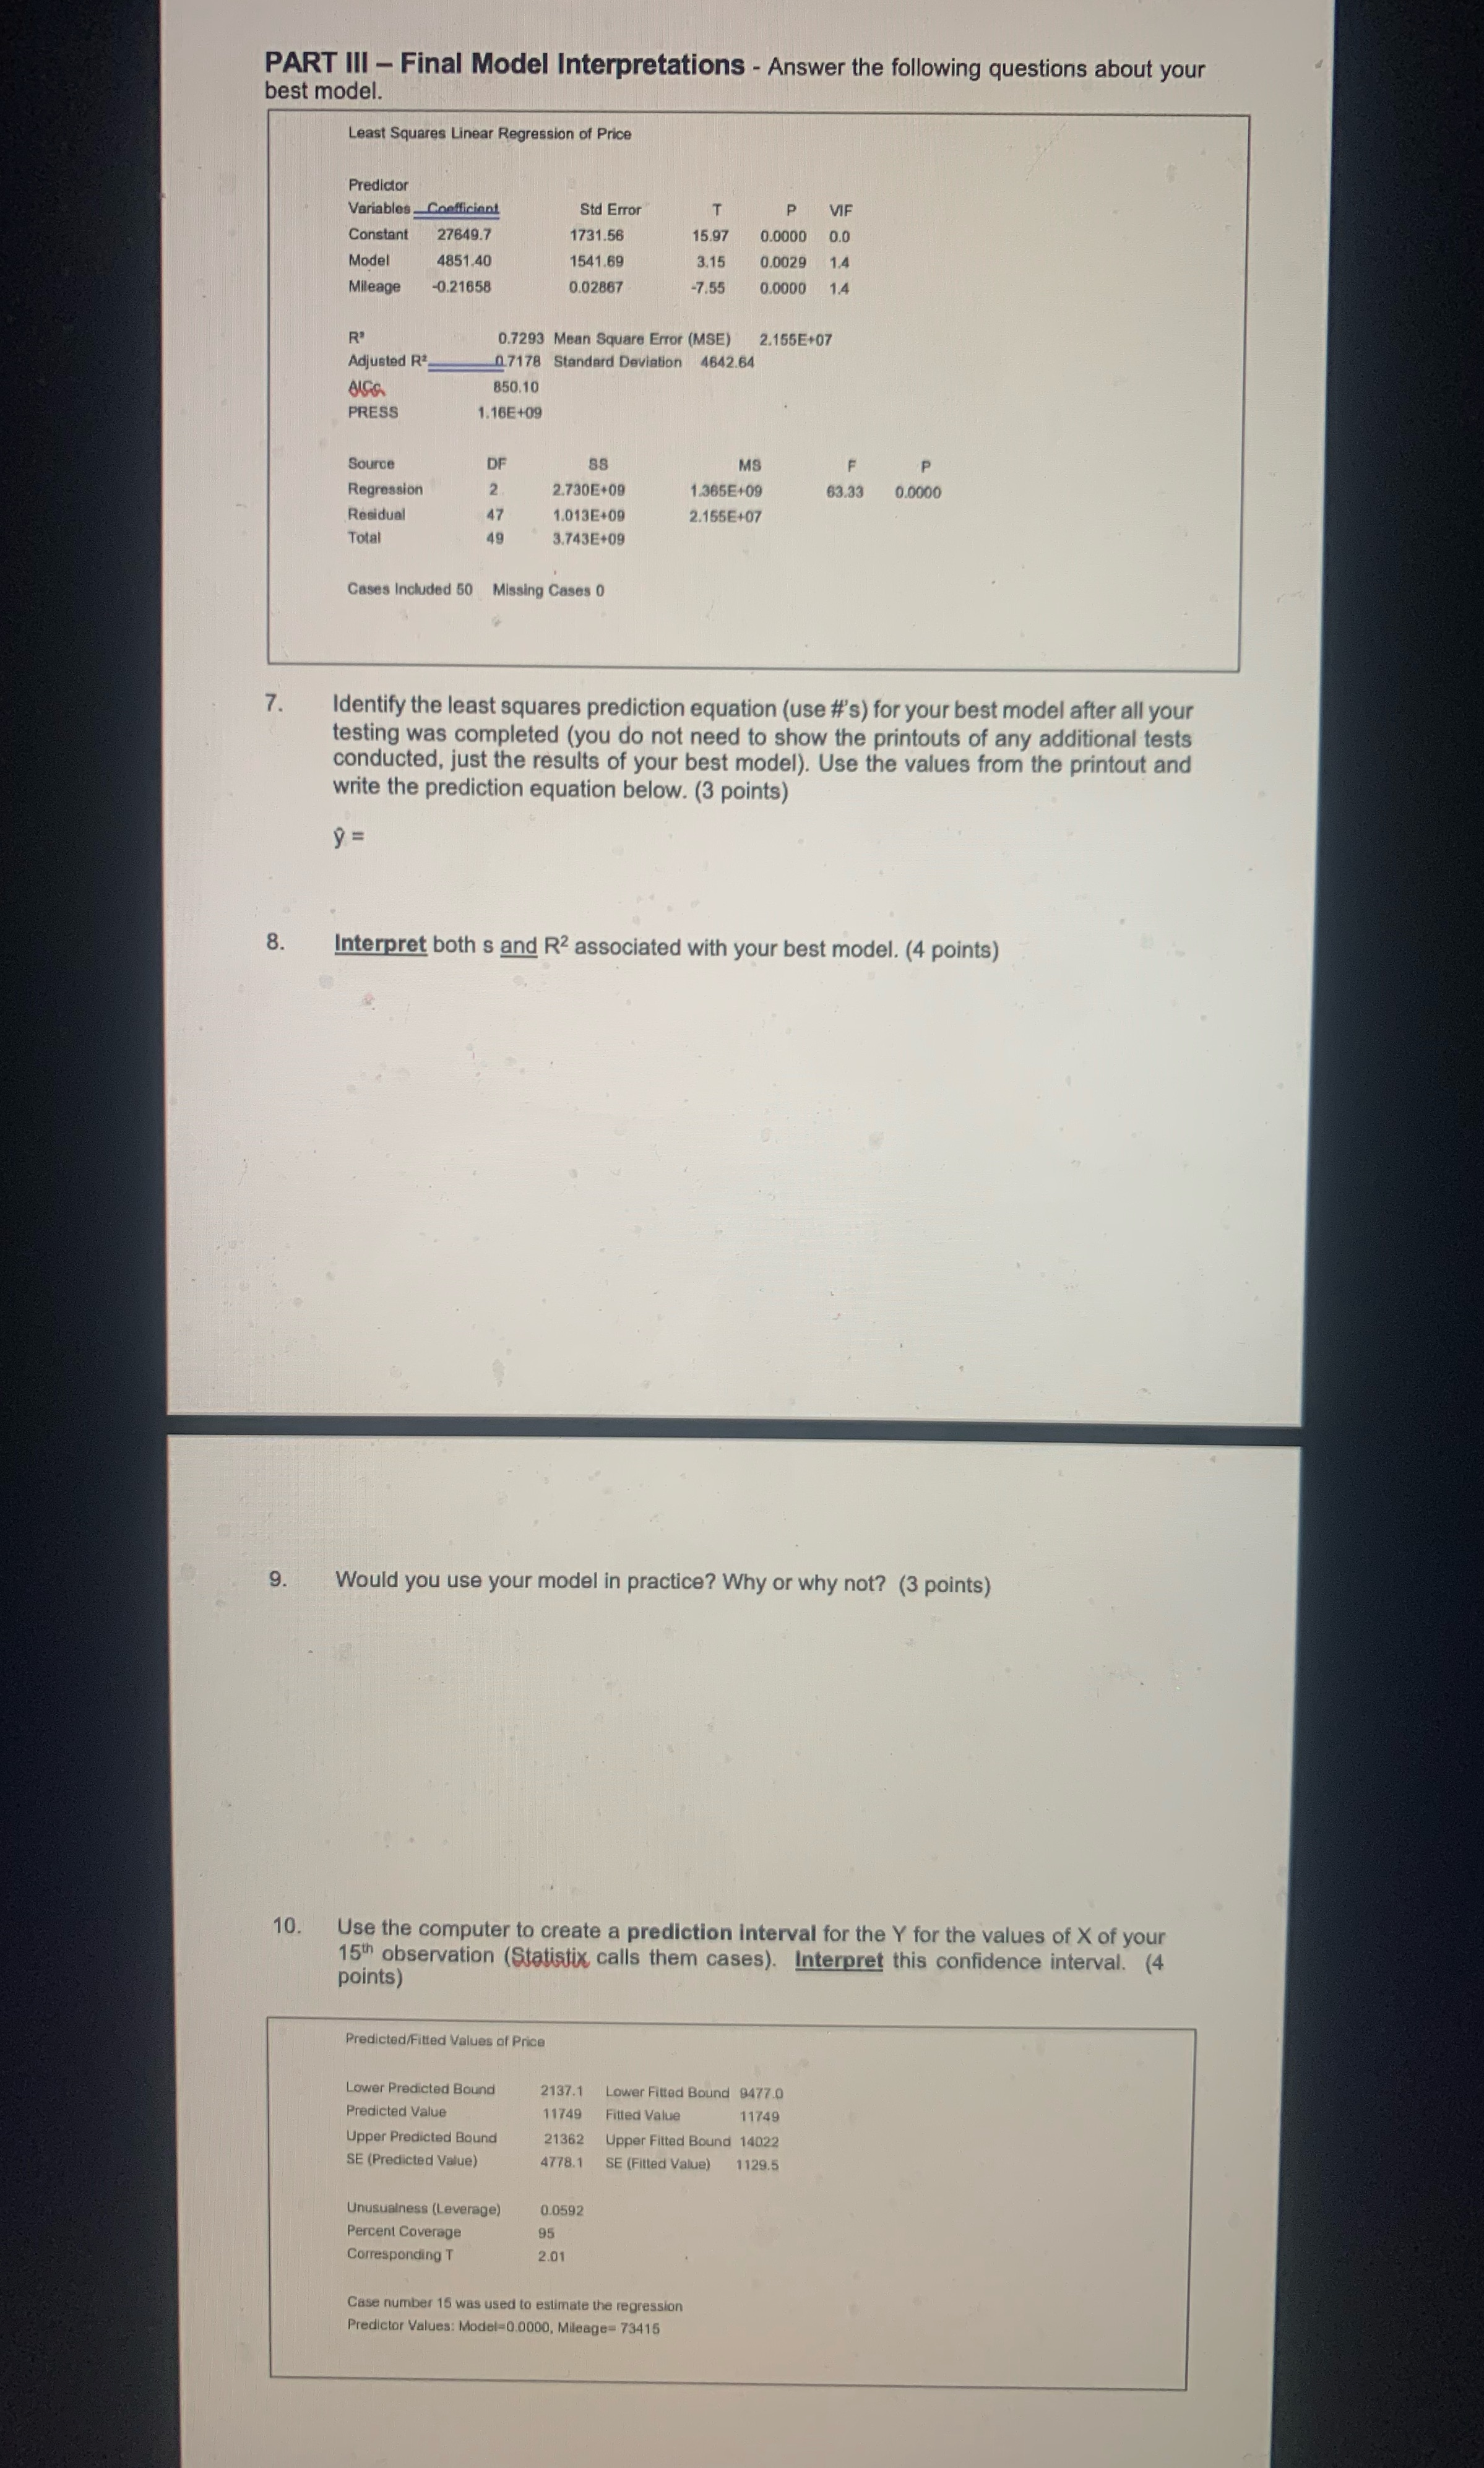
PART III - Final Model Interpretations - Answer the following questions about your best model. Least Squares Linear Regression of Price Predictor Variables _Coefficient Std Error P VIF Constant 27649.7 1731.56 15.97 0.0000 0.0 Model 4851.40 1541.69 3.15 0.0029 14 Mileage -0.21658 0.02867 -7.55 0.0000 14 0.7293 Mean Square Error (MSE) 2.155E+07 Adjusted Rz 0.7178 Standard Deviation 4642.64 850.10 PRESS 1.16E+09 Source DF MS Regression 2.730E+09 1.365E+09 63.33 0.0000 Residual 47 1.013E+09 2.155E+07 Total 10 3.743E+09 Cases Included 50 Missing Cases 0 7. Identify the least squares prediction equation (use #'s) for your best model after all your testing was completed (you do not need to show the printouts of any additional tests conducted, just the results of your best model). Use the values from the printout and write the prediction equation below. (3 points) y = 8. Interpret both s and R2 associated with your best model. (4 points) 9. Would you use your model in practice? Why or why not? (3 points) 10. Use the computer to create a prediction interval for the Y for the values of X of your points) 15th observation (Statistix calls them cases). Interpret this confidence interval. (4 Predicted/Fitted Values of Price Lower Predicted Bound 2137.1 Lower Fitted Bound 8477.0 Predicted Value 11749 Fitted Value 11749 Upper Predicted Bound 21362 Upper Fitted Bound 14022 SE (Predicted Value) 4778.1 SE (Fitted Value) 1129.5 Unusualness (Leverage) 0.0592 Percent Coverage 95 Corresponding T 2.01 Case number 15 was used to estimate the regression Predictor Values: Model=0.0000, Mileage= 73415
Step by Step Solution
There are 3 Steps involved in it

Get step-by-step solutions from verified subject matter experts