

Question: can you answer E please given the excel B. Suppose Beta Management's position had been 99% of equity funds invested in Vanguard's Index Fund and
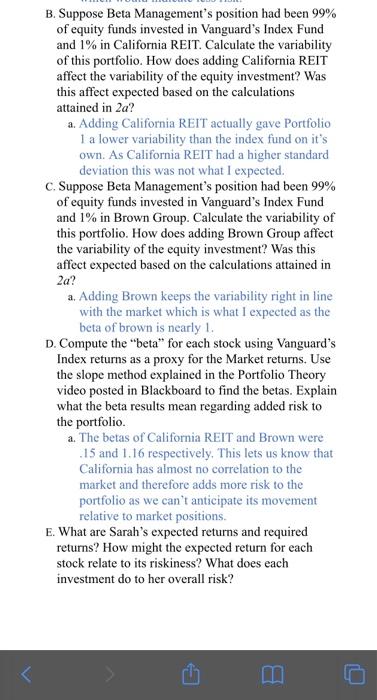
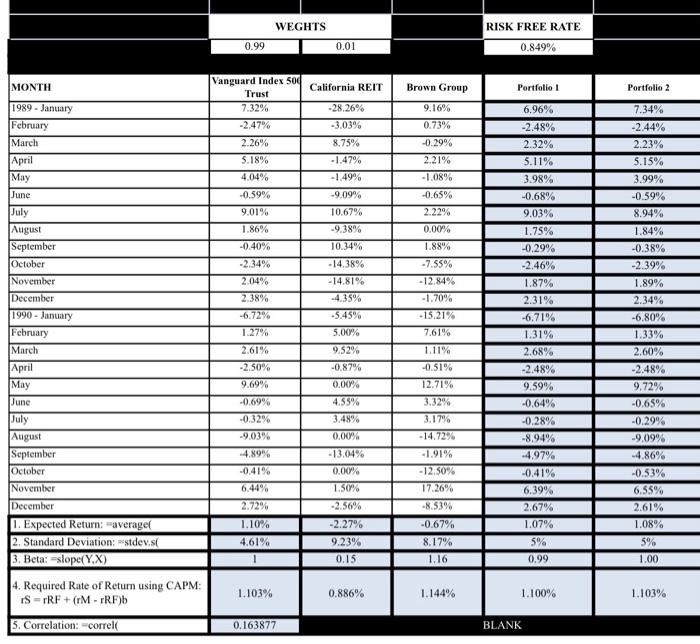
B. Suppose Beta Management's position had been 99% of equity funds invested in Vanguard's Index Fund and 1% in California REIT. Calculate the variability of this portfolio. How does adding California REIT affect the variability of the equity investment? Was this affect expected based on the calculations attained in 2a? a. Adding California REIT actually gave Portfolio 1 a lower variability than the index fund on it's own. As California REIT had a higher standard deviation this was not what I expected. C. Suppose Beta Management's position had been 99% of equity funds invested in Vanguard's Index Fund and 1% in Brown Group. Calculate the variability of this portfolio. How does adding Brown Group affect the variability of the equity investment? Was this affect expected based on the calculations attained in 2a? a. Adding Brown keeps the variability right in line with the market which is what I expected as the beta of brown is nearly 1. D. Compute the "beta" for each stock using Vanguard's Index returns as a proxy for the Market returns. Use the slope method explained in the Portfolio Theory video posted in Blackboard to find the betas. Explain what the beta results mean regarding added risk to the portfolio. a. The betas of California REIT and Brown were 15 and 1.16 respectively. This lets us know that California has almost no correlation to the market and therefore adds more risk to the portfolio as we can't anticipate its movement relative to market positions. E. What are Sarah's expected returns and required returns? How might the expected return for each stock relate to its riskiness? What does each investment do to her overall risk? WEGHTS RISK FREE RATE 0.99 0.01 0.849% Vanguard Index 500 MONTH California REIT Brown Group Portfolio 1 Portfolio 2 Trust 7.32% 9.16% 6.96% -28.26% -3.03% 7.34% -2.44% -2.47% 0.73% -2.48% 2.26% 8.75% -0.29% 2.32% 2.23% 5.18% -1.47% 2.21% 5.11% 5.15% 4.04% -1.49% -1.08% 3.98% 3.99% -0.59% -9.09% -0.65% -0.68% -0.59% 9.01% 10.67% 2.22% 9.03% 8.94% 1.86% -9.38% 0.00% 1.75% 1.84% -0.40% 10.34% 1.88% -0.29% -0.38% -2.34% -7.55% -2.46% -2.39% -14.38% -14.81% 2.04% -12.84% 1.87% 1.89% 2.38% -4.35% -1.70% 2.31% 2.34% -6.72% -5.45% -15.21% -6.71% -6.80% 5.00% 7.61% 1.31% 1.33% 1989. January February March April May June July August September October November December 1990 - January February March April May June July August September October November December 1. Expected Return: average 2. Standard Deviation: --stdev.si 3. Beta: slope(Y.X) 4. Required Rate of Return using CAPM: IS TRF +(M-TRF) 2.61% 9.52% 1.11% 2.68% 2.60% -2.50% -0.87% -0.51% -2.48% -2.48% 9.69% 0.00% 12.71% 9.59% 9.72% -0.69% 4.55% 3.32% -0.64% -0.65% -0.32% 3.48% 3.17% -0.28% -0.29% -9.03% -14.72% -8.94% -9.09% 0.00% -13.04% -4.89% -1.91% -4.97% -4.86% -0.41% 0.00% -0.41% -0.53% - 12.50% 17.26% 6.44% 1.50% 6.39% 6.55% 2.72% -2.56% -8.53% 2.61% 2.67% 1.07% 1.10% -2.27% -0.67% 1.08% 4.61% 9.23% 8.17% 5% 5% 1 0.15 1.16 0.99 1.00 1.103% 0.886% 1.144% 1. 100% 1.103% 5. Correlation: correl 0.163877 BLANK B. Suppose Beta Management's position had been 99% of equity funds invested in Vanguard's Index Fund and 1% in California REIT. Calculate the variability of this portfolio. How does adding California REIT affect the variability of the equity investment? Was this affect expected based on the calculations attained in 2a? a. Adding California REIT actually gave Portfolio 1 a lower variability than the index fund on it's own. As California REIT had a higher standard deviation this was not what I expected. C. Suppose Beta Management's position had been 99% of equity funds invested in Vanguard's Index Fund and 1% in Brown Group. Calculate the variability of this portfolio. How does adding Brown Group affect the variability of the equity investment? Was this affect expected based on the calculations attained in 2a? a. Adding Brown keeps the variability right in line with the market which is what I expected as the beta of brown is nearly 1. D. Compute the "beta" for each stock using Vanguard's Index returns as a proxy for the Market returns. Use the slope method explained in the Portfolio Theory video posted in Blackboard to find the betas. Explain what the beta results mean regarding added risk to the portfolio. a. The betas of California REIT and Brown were 15 and 1.16 respectively. This lets us know that California has almost no correlation to the market and therefore adds more risk to the portfolio as we can't anticipate its movement relative to market positions. E. What are Sarah's expected returns and required returns? How might the expected return for each stock relate to its riskiness? What does each investment do to her overall risk? WEGHTS RISK FREE RATE 0.99 0.01 0.849% Vanguard Index 500 MONTH California REIT Brown Group Portfolio 1 Portfolio 2 Trust 7.32% 9.16% 6.96% -28.26% -3.03% 7.34% -2.44% -2.47% 0.73% -2.48% 2.26% 8.75% -0.29% 2.32% 2.23% 5.18% -1.47% 2.21% 5.11% 5.15% 4.04% -1.49% -1.08% 3.98% 3.99% -0.59% -9.09% -0.65% -0.68% -0.59% 9.01% 10.67% 2.22% 9.03% 8.94% 1.86% -9.38% 0.00% 1.75% 1.84% -0.40% 10.34% 1.88% -0.29% -0.38% -2.34% -7.55% -2.46% -2.39% -14.38% -14.81% 2.04% -12.84% 1.87% 1.89% 2.38% -4.35% -1.70% 2.31% 2.34% -6.72% -5.45% -15.21% -6.71% -6.80% 5.00% 7.61% 1.31% 1.33% 1989. January February March April May June July August September October November December 1990 - January February March April May June July August September October November December 1. Expected Return: average 2. Standard Deviation: --stdev.si 3. Beta: slope(Y.X) 4. Required Rate of Return using CAPM: IS TRF +(M-TRF) 2.61% 9.52% 1.11% 2.68% 2.60% -2.50% -0.87% -0.51% -2.48% -2.48% 9.69% 0.00% 12.71% 9.59% 9.72% -0.69% 4.55% 3.32% -0.64% -0.65% -0.32% 3.48% 3.17% -0.28% -0.29% -9.03% -14.72% -8.94% -9.09% 0.00% -13.04% -4.89% -1.91% -4.97% -4.86% -0.41% 0.00% -0.41% -0.53% - 12.50% 17.26% 6.44% 1.50% 6.39% 6.55% 2.72% -2.56% -8.53% 2.61% 2.67% 1.07% 1.10% -2.27% -0.67% 1.08% 4.61% 9.23% 8.17% 5% 5% 1 0.15 1.16 0.99 1.00 1.103% 0.886% 1.144% 1. 100% 1.103% 5. Correlation: correl 0.163877 BLANK
Step by Step Solution
There are 3 Steps involved in it

Get step-by-step solutions from verified subject matter experts