

Question: I need help with question E d. Compute the beta for each stock using Vanguard's Index returns as a proxy for the Market returns. Use
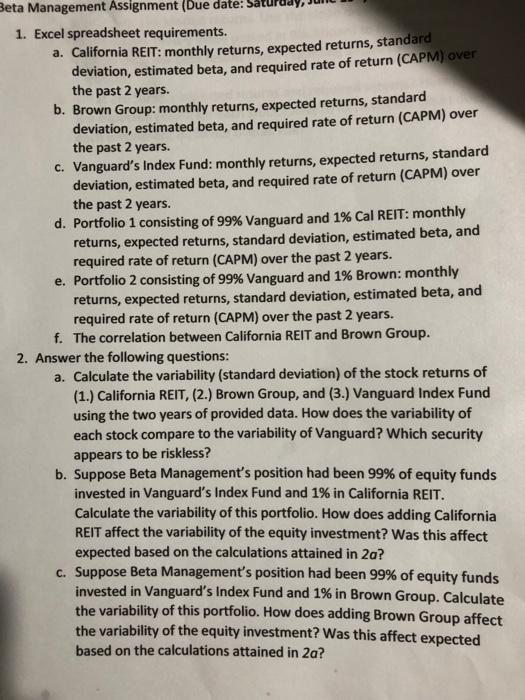
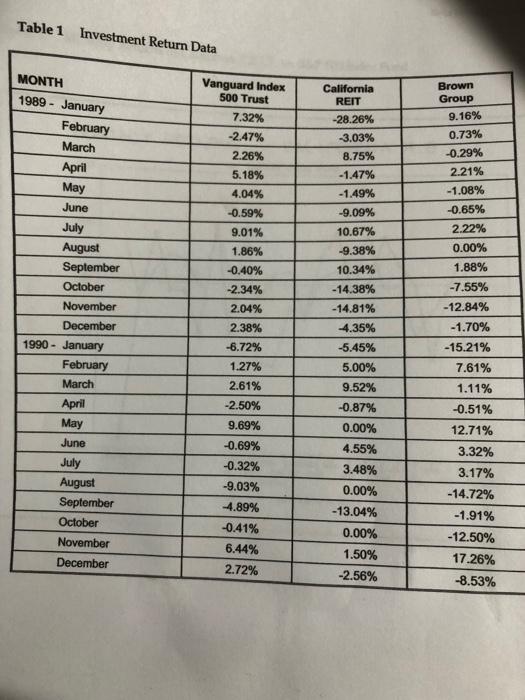
d. Compute the "beta" for each stock using Vanguard's Index returns as a proxy for the Market returns. Use the slope method explained in the Portfolio Theory video posted in Blackboard to find the betas. Explain what the beta results mean regarding added risk to the portfolio. e. What are Sarah's expected returns and required returns? How might the expected return for each stock relate to its riskiness? What does each investment do to her overall risk? Beta Management Assignment (Due date: 1. Excel spreadsheet requirements. a. California REIT: monthly returns, expected returns, standard deviation, estimated beta, and required rate of return (CAPM) over the past 2 years. b. Brown Group: monthly returns, expected returns, standard deviation, estimated beta, and required rate of return (CAPM) over the past 2 years. c. Vanguard's Index Fund: monthly returns, expected returns, standard deviation, estimated beta, and required rate of return (CAPM) over the past 2 years. d. Portfolio 1 consisting of 99% Vanguard and 1% Cal REIT: monthly returns, expected returns, standard deviation, estimated beta, and required rate of return (CAPM) over the past 2 years. e. Portfolio 2 consisting of 99% Vanguard and 1% Brown: monthly returns, expected returns, standard deviation, estimated beta, and required rate of return (CAPM) over the past 2 years. f. The correlation between California REIT and Brown Group. 2. Answer the following questions: a. Calculate the variability (standard deviation) of the stock returns of (1.) California REIT, (2.) Brown Group, and (3.) Vanguard Index Fund using the two years of provided data. How does the variability of each stock compare to the variability of Vanguard? Which security appears to be riskless? b. Suppose Beta Management's position had been 99% of equity funds invested in Vanguard's Index Fund and 1% in California REIT. Calculate the variability of this portfolio. How does adding California REIT affect the variability of the equity investment? Was this affect expected based on the calculations attained in 2a? c. Suppose Beta Management's position had been 99% of equity funds invested in Vanguard's Index Fund and 1% in Brown Group. Calculate the variability of this portfolio. How does adding Brown Group affect the variability of the equity investment? Was this affect expected based on the calculations attained in 2a? Table 1 Investment Return Data MONTH Vanguard Index 500 Trust California REIT Brown Group 1989 - January 7.32% -28.26% 9.16% February -2.47% 3.03% 0.73% March 2.26% 8.75% -0.29% April May 5.18% -1.47% 2.21% 4.04% -1.49% -1.08% June -0.59% -9.09% -0.65% July 9.01% 10.67% 2.22% 1.86% -9.38% 0.00% August September -0.40% 10.34% 1.88% October -2.34% -14.38% -7.55% November 2.04% -14.81% -12.84% December 2.38% 4.35% -1.70% -6.72% -5.45% -15.21% 1990 - January February March 1.27% 5.00% 7.61% 2.61% 9.52% 1.11% April -2.50% -0.87% -0.51% May 9.69% 0.00% 12.71% June -0.69% 4.55% 3.32% July -0.32% 3.48% 3.17% -9.03% 0.00% -14.72% August September October -4.89% -13.04% -1.91% -0.41% 0.00% November - 12.50% 6.44% 1.50% December 17.26% 2.72% -2.56% -8.53% d. Compute the "beta" for each stock using Vanguard's Index returns as a proxy for the Market returns. Use the slope method explained in the Portfolio Theory video posted in Blackboard to find the betas. Explain what the beta results mean regarding added risk to the portfolio. e. What are Sarah's expected returns and required returns? How might the expected return for each stock relate to its riskiness? What does each investment do to her overall risk? Beta Management Assignment (Due date: 1. Excel spreadsheet requirements. a. California REIT: monthly returns, expected returns, standard deviation, estimated beta, and required rate of return (CAPM) over the past 2 years. b. Brown Group: monthly returns, expected returns, standard deviation, estimated beta, and required rate of return (CAPM) over the past 2 years. c. Vanguard's Index Fund: monthly returns, expected returns, standard deviation, estimated beta, and required rate of return (CAPM) over the past 2 years. d. Portfolio 1 consisting of 99% Vanguard and 1% Cal REIT: monthly returns, expected returns, standard deviation, estimated beta, and required rate of return (CAPM) over the past 2 years. e. Portfolio 2 consisting of 99% Vanguard and 1% Brown: monthly returns, expected returns, standard deviation, estimated beta, and required rate of return (CAPM) over the past 2 years. f. The correlation between California REIT and Brown Group. 2. Answer the following questions: a. Calculate the variability (standard deviation) of the stock returns of (1.) California REIT, (2.) Brown Group, and (3.) Vanguard Index Fund using the two years of provided data. How does the variability of each stock compare to the variability of Vanguard? Which security appears to be riskless? b. Suppose Beta Management's position had been 99% of equity funds invested in Vanguard's Index Fund and 1% in California REIT. Calculate the variability of this portfolio. How does adding California REIT affect the variability of the equity investment? Was this affect expected based on the calculations attained in 2a? c. Suppose Beta Management's position had been 99% of equity funds invested in Vanguard's Index Fund and 1% in Brown Group. Calculate the variability of this portfolio. How does adding Brown Group affect the variability of the equity investment? Was this affect expected based on the calculations attained in 2a? Table 1 Investment Return Data MONTH Vanguard Index 500 Trust California REIT Brown Group 1989 - January 7.32% -28.26% 9.16% February -2.47% 3.03% 0.73% March 2.26% 8.75% -0.29% April May 5.18% -1.47% 2.21% 4.04% -1.49% -1.08% June -0.59% -9.09% -0.65% July 9.01% 10.67% 2.22% 1.86% -9.38% 0.00% August September -0.40% 10.34% 1.88% October -2.34% -14.38% -7.55% November 2.04% -14.81% -12.84% December 2.38% 4.35% -1.70% -6.72% -5.45% -15.21% 1990 - January February March 1.27% 5.00% 7.61% 2.61% 9.52% 1.11% April -2.50% -0.87% -0.51% May 9.69% 0.00% 12.71% June -0.69% 4.55% 3.32% July -0.32% 3.48% 3.17% -9.03% 0.00% -14.72% August September October -4.89% -13.04% -1.91% -0.41% 0.00% November - 12.50% 6.44% 1.50% December 17.26% 2.72% -2.56% -8.53%
Step by Step Solution
There are 3 Steps involved in it

Get step-by-step solutions from verified subject matter experts