

Question: can you do number 2 only? can you do number 2 only? (swipe to the last two image to see the clear version) 1. Parts
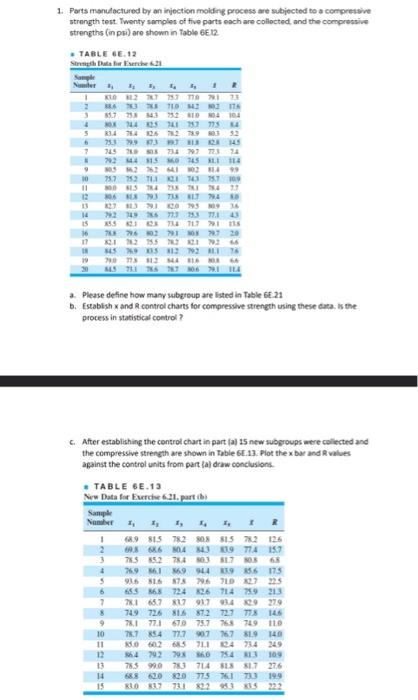
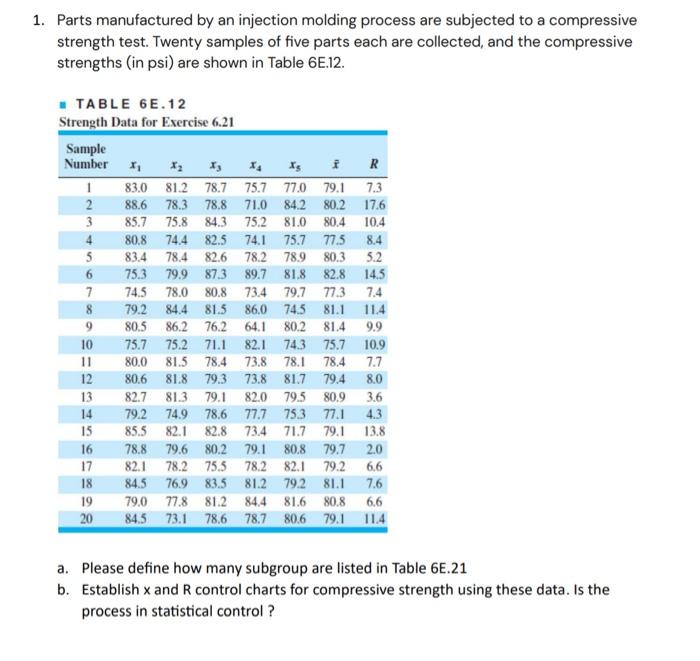
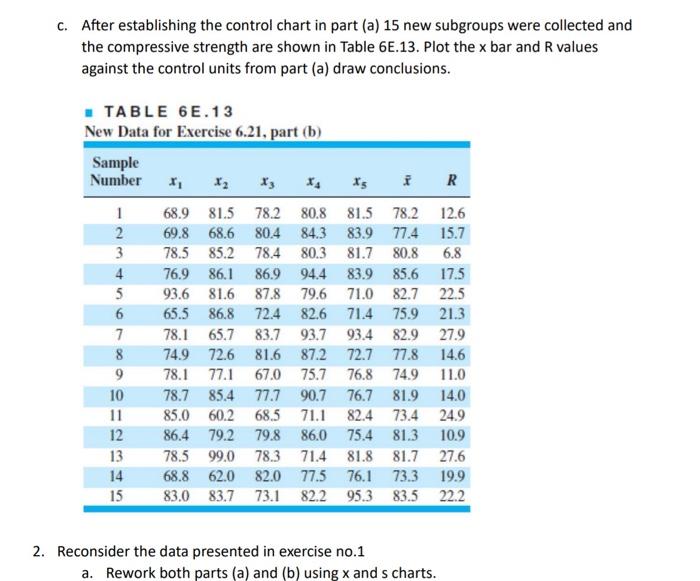
1. Parts manulactured by an injection molding process are subjected te a comprestive strongth test. Twenty semples of five parts each are collected, and the compressive strengths (in pii) are shown in Table 6E12 Tafte 6f.12 a. Please define how many subereup are listed in Table 6.21 b. Establish x and R control charts for cempreswe strength using these dara. Is the process in statistical control? c. After establishing the control chart in part (a) 15 new subgroups were coliected and the compressive strength are shown in Table 6. .13. Plot the x bar and R values against the control units from part fa) draw conclusions. Parts manufactured by an injection molding process are subjected to a compressive strength test. Twenty samples of five parts each are collected, and the compressive strengths (in psi) are shown in Table 6E.12. - TABLE 6E.12 a. Please define how many subgroup are listed in Table 6E.21 b. Establish x and R control charts for compressive strength using these data. Is the process in statistical control ? c. After establishing the control chart in part (a) 15 new subgroups were collected and the compressive strength are shown in Table 6E.13. Plot the x bar and R values against the control units from part (a) draw conclusions. - TABLE 6E13 Now Data for Exorcise 6.21. nart (h) 2. Reconsider the data presented in exercise no.1 a. Rework both parts (a) and (b) using x and s charts. 1. Parts manulactured by an injection molding process are subjected te a comprestive strongth test. Twenty semples of five parts each are collected, and the compressive strengths (in pii) are shown in Table 6E12 Tafte 6f.12 a. Please define how many subereup are listed in Table 6.21 b. Establish x and R control charts for cempreswe strength using these dara. Is the process in statistical control? c. After establishing the control chart in part (a) 15 new subgroups were coliected and the compressive strength are shown in Table 6. .13. Plot the x bar and R values against the control units from part fa) draw conclusions. Parts manufactured by an injection molding process are subjected to a compressive strength test. Twenty samples of five parts each are collected, and the compressive strengths (in psi) are shown in Table 6E.12. - TABLE 6E.12 a. Please define how many subgroup are listed in Table 6E.21 b. Establish x and R control charts for compressive strength using these data. Is the process in statistical control ? c. After establishing the control chart in part (a) 15 new subgroups were collected and the compressive strength are shown in Table 6E.13. Plot the x bar and R values against the control units from part (a) draw conclusions. - TABLE 6E13 Now Data for Exorcise 6.21. nart (h) 2. Reconsider the data presented in exercise no.1 a. Rework both parts (a) and (b) using x and s charts
Step by Step Solution
There are 3 Steps involved in it

Get step-by-step solutions from verified subject matter experts