

Question: (a-1) Select an Excel line graph of the following bond yield data. Seved U.S. Treasury 10-Year Bond Yields at Week's End (n = 52
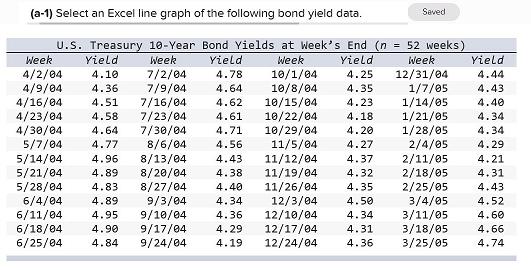
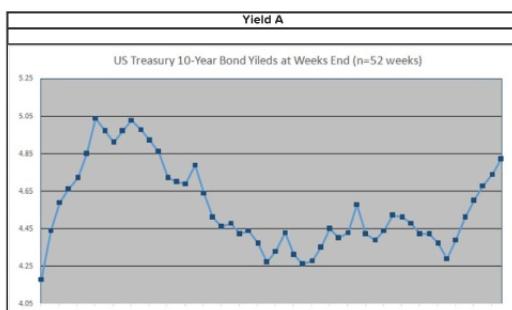
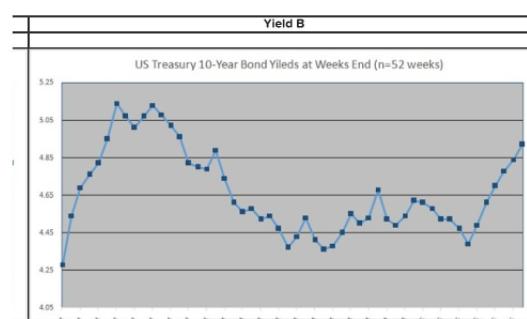
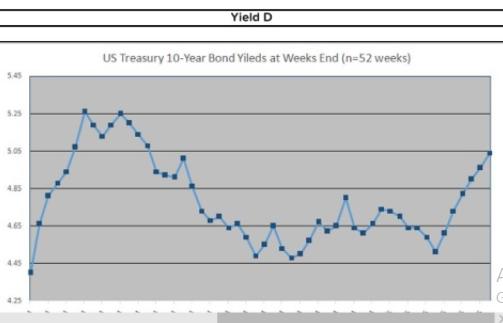
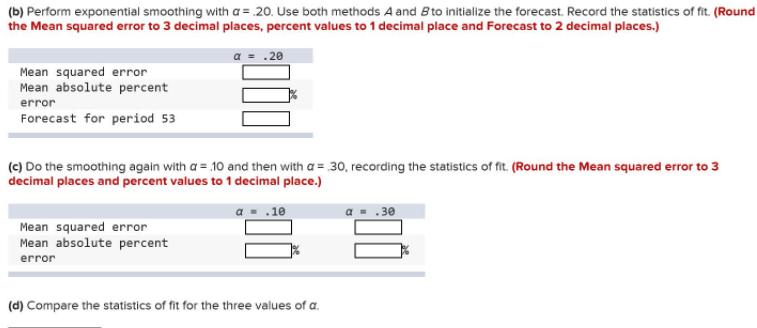
(a-1) Select an Excel line graph of the following bond yield data. Seved U.S. Treasury 10-Year Bond Yields at Week's End (n = 52 weeks) Week Yield Week Yield Week Yield Week Yield 4/2/04 4/9/04 4/16/04 4/23/04 4/30/04 5/7/04 5/14/04 5/21/04 5/28/04 6/4/04 6/11/04 6/18/04 6/25/04 7/2/04 7/9/04 7/16/04 7/23/04 7/30/04 /6/04 8/13/04 8/20/04 8/27/04 9/3/04 9/10/04 9/17/04 9/24/04 10/1/04 10/8/04 10/15/04 10/22/04 12/31/04 1/7/05 1/14/05 1/21/05 1/28/05 2/4/05 2/11/05 2/18/05 2/25/05 3/4/05 3/11/05 3/18/05 3/25/05 4.10 4.78 4.25 4.44 4.36 4.64 4.35 4.43 4.51 4.62 4.23 4.40 4.58 4.61 4.18 4.34 4.64 4.71 10/29/04 11/5/04 11/12/04 11/19/04 11/26/04 12/3/04 12/10/04 12/17/04 12/24/04 4.20 4.34 4.77 4.56 4.27 4.29 4.96 4.43 4.37 4.21 4.89 4.38 4.32 4.31 4.83 4.40 4.35 4.43 4.89 4.34 4.50 4.52 4.95 4.36 4.34 4.60 4.90 4.29 4.31 4.66 4.84 4.19 4.36 4.74 Yield A US Treasury 10-Year Bond Yileds at Weeks End (n=52 weeks) 525 5.05 4.65 4.25 Yield B US Treasury 10-Year Bond Yileds at Weeks End (n-52 weeks) 525 505 485 4.65 445 425 405 Yield C US Treasury 10-Year Bond Yileds at Weeks End (n=52 weeks) 5.25 5.05 4.65 4.45 4.25 Yield D US Treasury 10-Year Bond Yileds at Weeks End (n=52 weeks) 545 5.25 5.05 A5 4.65 445 425 (b) Perform exponential smoothing with a = 20. Use both methods A and Bto initialize the forecast. Record the statistics of fit. (Round the Mean squared error to 3 decimal places, percent values to 1 decimal place and Forecast to 2 decimal places.) .20 Mean squared error Mean absolute percent error Forecast for period 53 (c) Do the smoothing again with a = 10 and then with a = 30, recording the statistics of fit. (Round the Mean squared error to 3 decimal places and percent values to 1 decimal place.) .10 30 Mean squared error Mean absolute percent error (d) Compare the statistics of fit for the three values of a.
Step by Step Solution
3.36 Rating (149 Votes )
There are 3 Steps involved in it
To select the correct Excel line graph and perform exponential smoothing follow these steps Step 1 Select the Correct Graph Analyze the images of line ... View full answer

Get step-by-step solutions from verified subject matter experts