

Question: can you explain how you the answer? Remember, the expected value of a probability distribution is a statistical measure of the average (meas) value expected
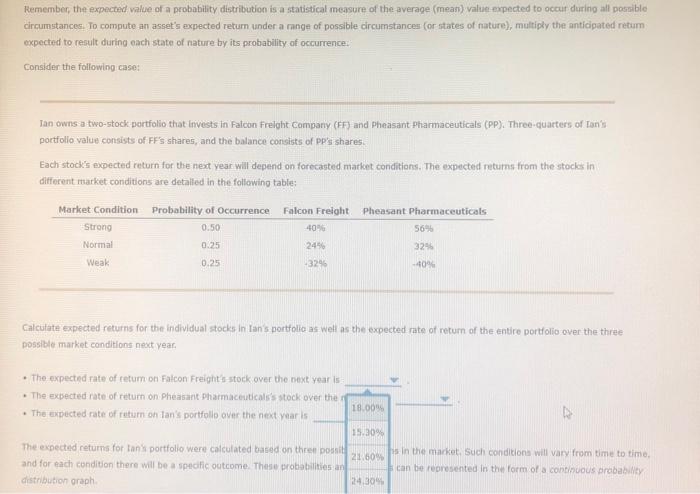
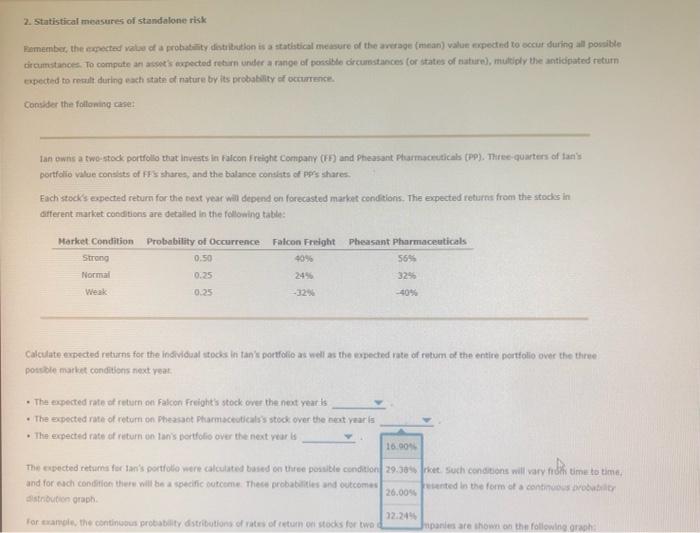
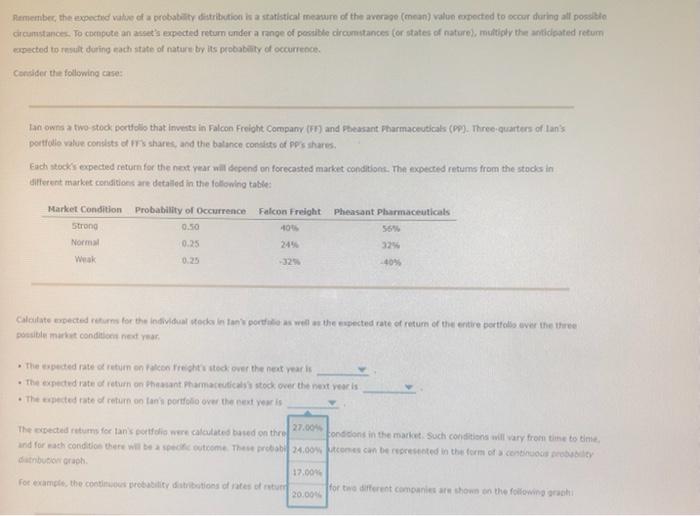
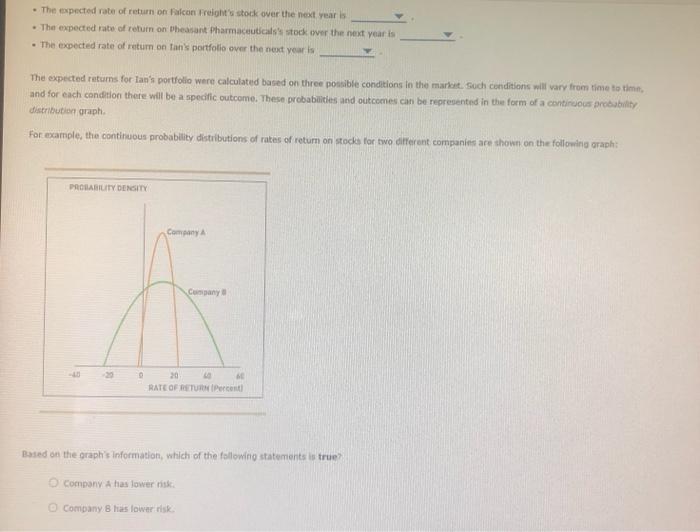
Remember, the expected value of a probability distribution is a statistical measure of the average (meas) value expected to occut during all posnible circumstances. To compute an asset's expected return under a range of possible circumstances (or states of nature), multiply the anticipated retum expected to result during each state of nature by its probability of occurrence: Consider the following case: Tan owns a two-stock pertfolio that invests in Falcon Frelght Company (FF) and pheasant Pharmaceuticals (PP). Three-quarters of Ian's portfollo value consists of FF's shares, and the balance consists of PP's shares. Each stock's expected return for the next year will depend on forecasted market conditions. The expected returns from the stocks in different market conditions are detalled in the following table: Calculate expected returns for the individual stocks in Ian's portfolio as well as the expected mate of retum of the entire portfolio over the three possible market conditions necc year. - The expected rate of retum on falcon Freight's stock over the next year is: - The expected rate of return on Pheasant Pharmaceuticals's stock over the sf - The expected rate of return on lan's portfollo over the next yaar is The expected returns for tan's portfolio were calculated based on thren possit and for each condition there will be a specfic outcome. These protabilities an distnibution oraph. 2. statistical measures of standalone risk dircumstances. To compute an aswe's expected retern under a range of pocible drcurstances (or states of natire), multiply the antiopated return. eqpected to mait during each sate of nature by its probablity of octimence. Consider the folloning rase: tan owns a two-stodk portfollo that invests in raicon freight Company (FF) and pheasant Plarmactiticab (pP). Thiree-quarters of taris portfolio vilue consists of FF S shares, and the balance conthts of pPrs shates. Esch stocks expected return for the neve year will depend on forecasted market conditions. The expected roturns from the stods in oiterent market conditions are detalled in the following table: Calculate expected returns for the individual atods in tan's portfolio as well as the empected rate of retum of the entice pertiolio over the three postiole market conditiens next yeat. - The expected rate of return on fakcon freight's stock ove the next year is - The expected rate of return on theasaot pharmaceuticals's stick over the nent vear is - The expected rate of return on lans dortfolio over the next year is dicumstances. To coenpute an asset's expected retum cnder a range of pentible circumstances (or states of nature), muitioly the antidgated retum eapected to result duting each state of naturn try its probablity of occurreder. Condider the following case: Lan owns a two-stod portdels that linwits in Falcon Freioht Company (in) and Fteasant Fharmaceuticals (PP). Three-quarters of lan's? portfolio value condsts of irs shares, and the belance consets of PPS shares. Each stocks expected teturn for the neat vear will depend on forecastes market conditiont. The expected retums from the stods in alferent market consitions are detalled in the following table: possible marive conditions nect rear, - The evected rate retum on facton riesht stod over the neat war is - The expected rate of teturf on thasant marmactuticaly stod over the next vear is - The cipested tate of return on tanis portfolo orer ve nest ves is - The tapected rate of return on falcon frelgit's stork over the next year is - The expected rate of return on eheasant pharmaceuticals? stoek twer the next year is - The expected rate of return on tans portfolio ower the nent yoar is The expected returns for lan's portfolio were calculated based on three possible conditions in the market. soch cenditions will vary trom time to thitin, and for each condetion there will be a speciflc outcome. These probabilites and outcomes can be represented in the form of a eantiruous prebybulth distributien graphi. For example, the continuous probablity distributions of rates of retum on stocks for two different companies are thown on the followitid oraph: Based on the graphis information, which of the followinv statements is true7 Cocmpany a has lower risk: Company 8 has lowar risk
Step by Step Solution
There are 3 Steps involved in it

Get step-by-step solutions from verified subject matter experts