

Question: can you explain it with graphics and please explain it clearly. Thank you Let us consider the following project with activity duration and cost data.
 can you explain it with graphics and please explain it clearly. Thank you
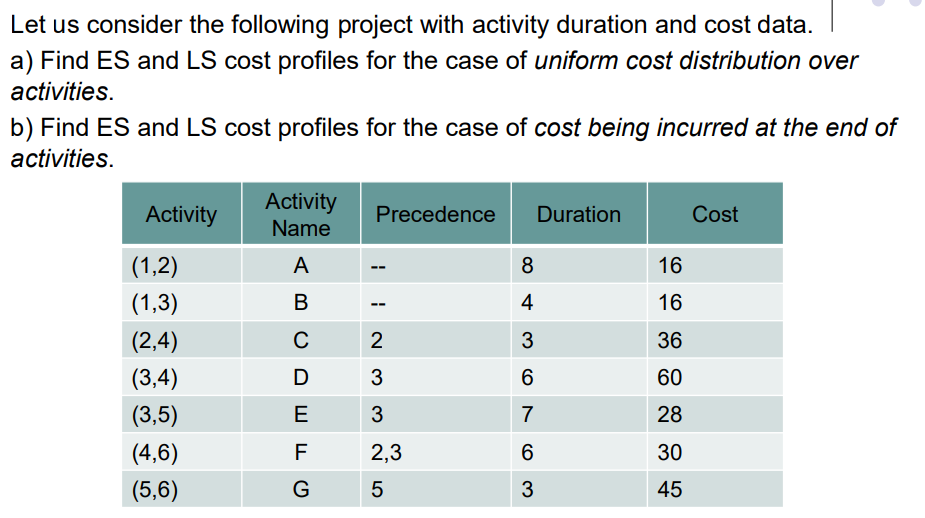
Let us consider the following project with activity duration and cost data. a) Find ES and LS cost profiles for the case of uniform cost distribution over activities. b) Find ES and LS cost profiles for the case of cost being incurred at the end of activities
Step by Step Solution
There are 3 Steps involved in it
1 Expert Approved Answer
Step: 1 Unlock

Question Has Been Solved by an Expert!
Get step-by-step solutions from verified subject matter experts
Step: 2 Unlock
Step: 3 Unlock