

Question: Can you explain this question with the explanation answer and how to solve this. Also part b & c ask for determine how many people
Can you explain this question with the explanation answer and how to solve this. Also part b & c ask for determine how many people were surveyed and determine how many people would like to have atleast one of these choices for lunch ?
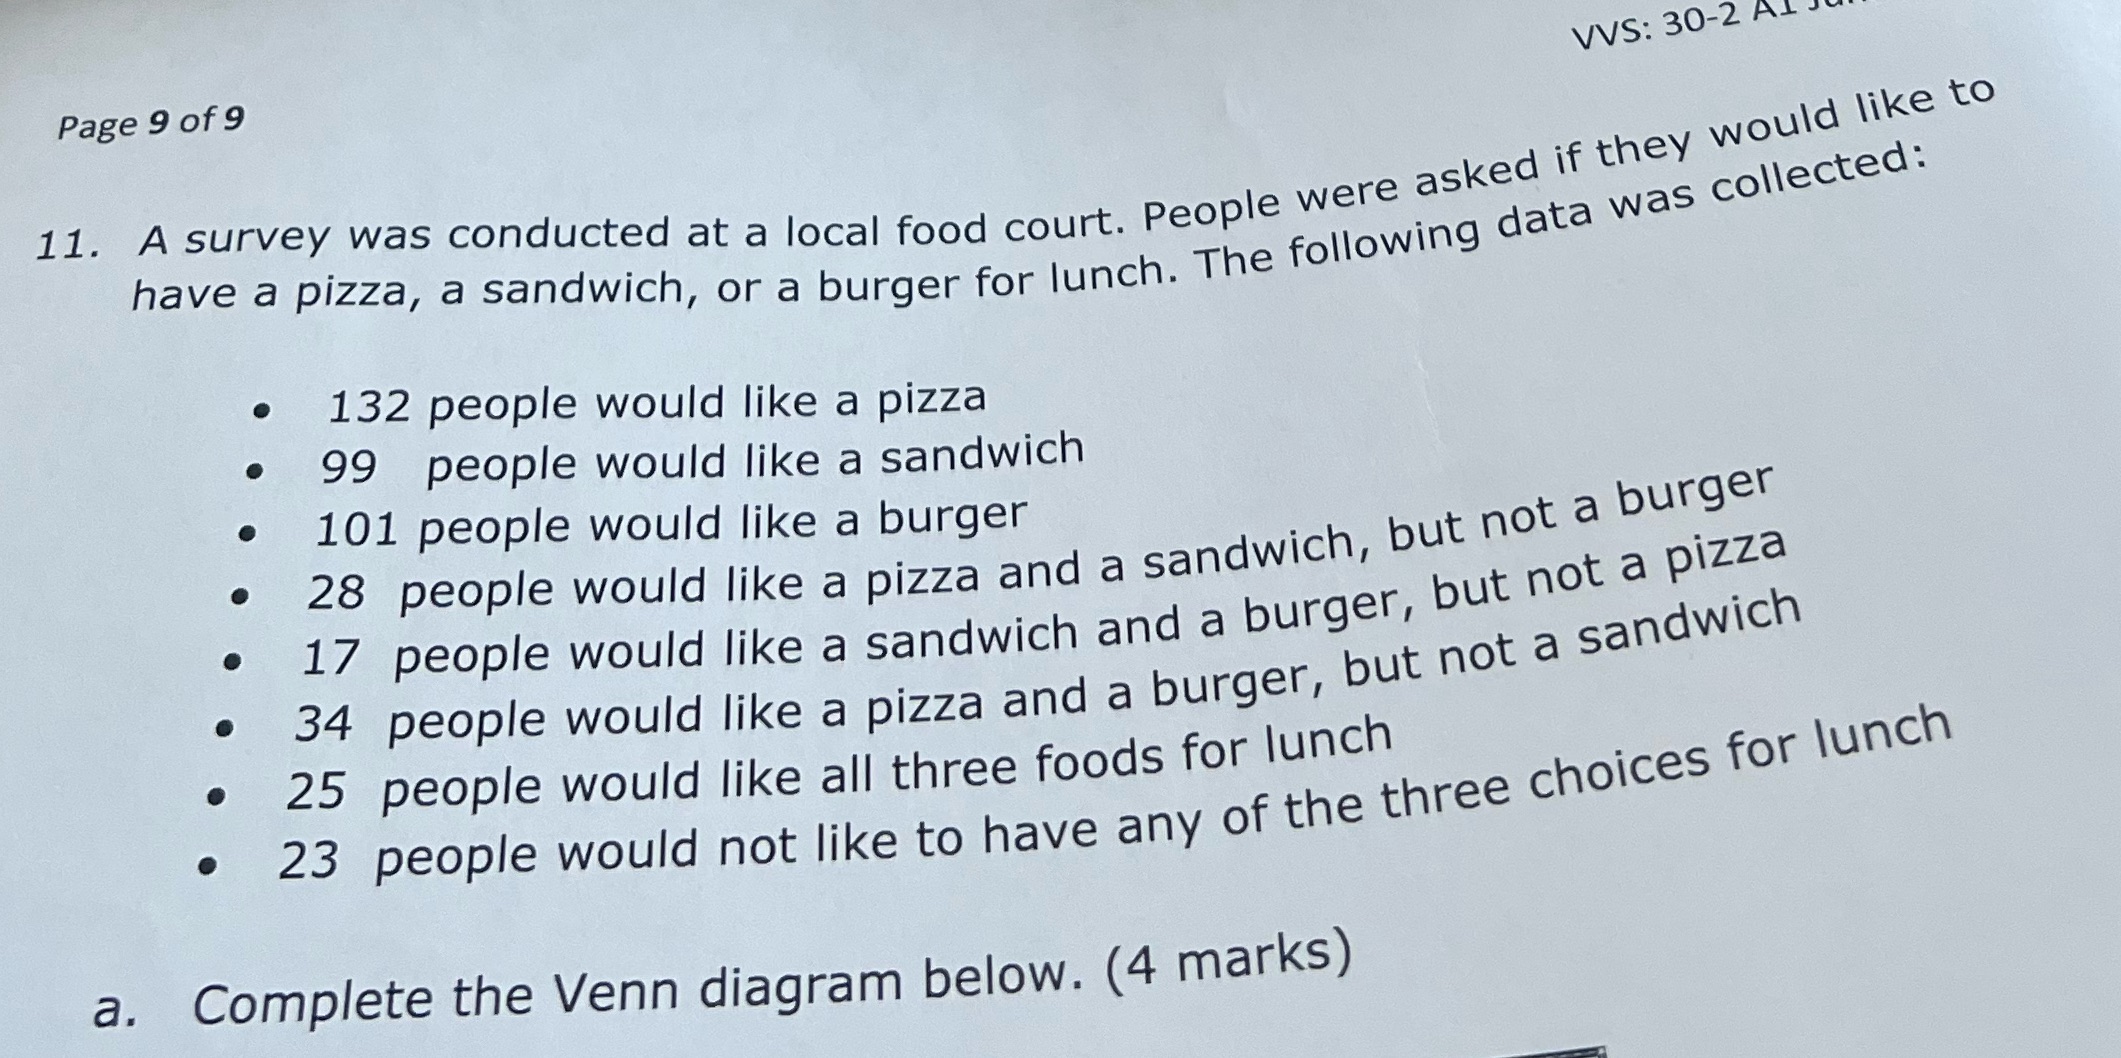
VVS: 30-2 AL Page 9 of 9 11. A survey was conducted at a local food court. People were asked if they would like to have a pizza, a sandwich, or a burger for lunch. The following data was collected : 132 people would like a pizza 99 people would like a sandwich . 101 people would like a burger . 28 people would like a pizza and a sandwich, but not a burger . 17 people would like a sandwich and a burger, but not a pizza 34 people would like a pizza and a burger, but not a sandwich . 25 people would like all three foods for lunch . 23 people would not like to have any of the three choices for lunch a. Complete the Venn diagram below. (4 marks)
Step by Step Solution
There are 3 Steps involved in it

Get step-by-step solutions from verified subject matter experts