

Question: Can you explain why in the first variation (left chart) accounts payable is overstated by 850 but in the second variation (right chart) the accounts
Can you explain why in the first variation (left chart) accounts payable is overstated by 850 but in the second variation (right chart) the accounts payable is ok. Should the purchase errors cancel out over the 2 year period? Overall, do balance sheet account errors translate to the next year?
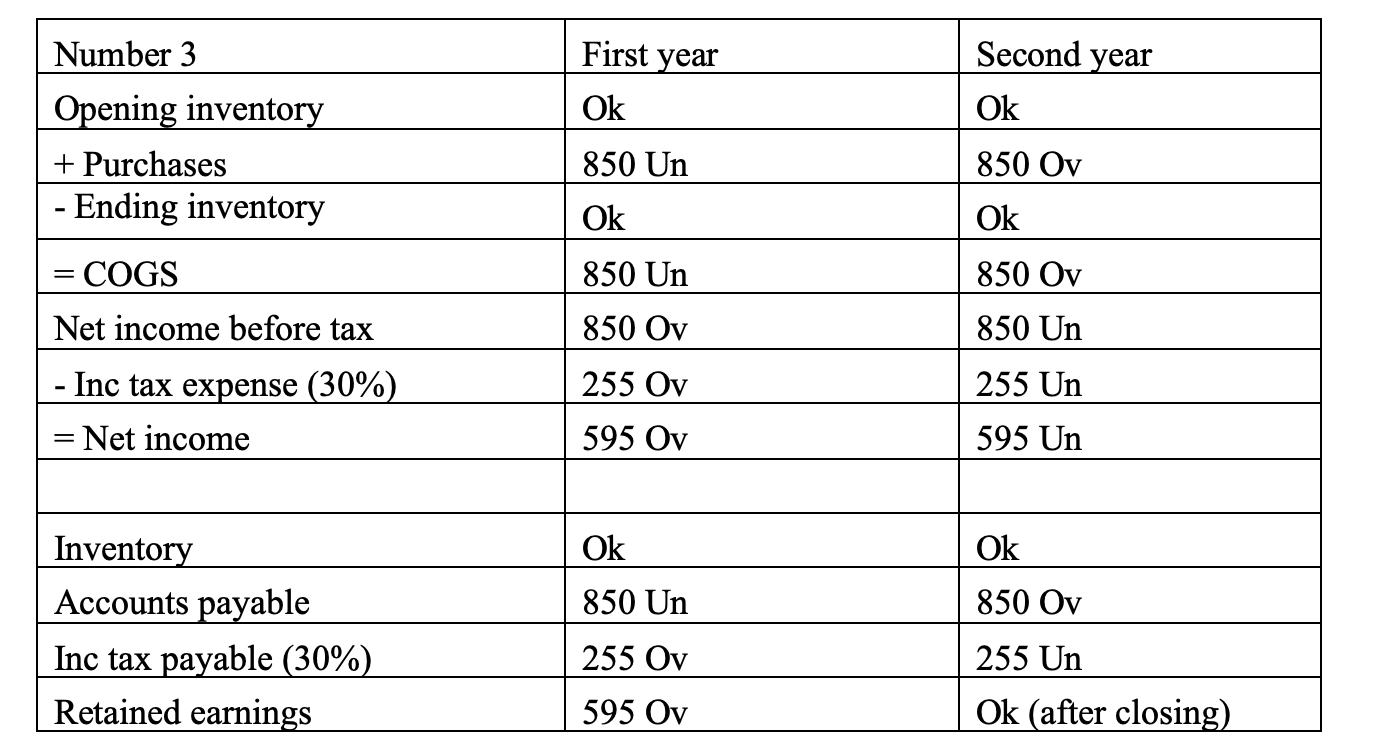
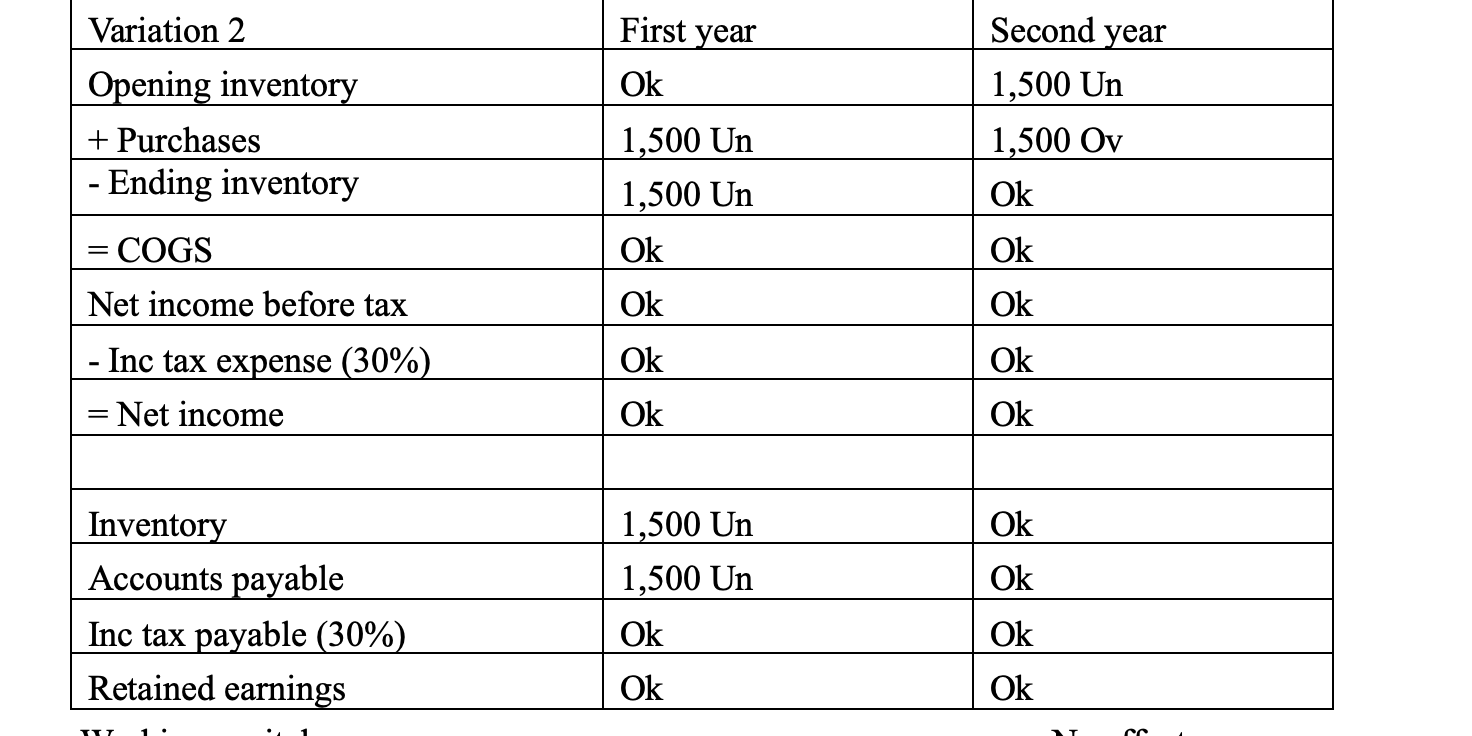
Number 3 First year Second year Ok Ok Opening inventory + Purchases Ending inventory 850 Un 850 Ov Ok Ok = = COGS 850 Un 850 Ov 850 Ov 850 Un Net income before tax Inc tax expense (30%) = Net income 255 Ov 255 Un = 595 Ov 595 Un Ok Ok 850 Un 850 Ov Inventory Accounts payable Inc tax payable (30%) Retained earnings 255 Ov 255 Un 595 Ov Ok (after closing) Variation 2 First year Second year Ok Opening inventory + Purchases - Ending inventory 1,500 Un 1,500 Un Ok 1,500 Un 1,500 Ov Ok = COGS Ok Ok Ok Net income before tax - Inc tax expense (30%). = Net income Ok Ok Ok Ok Ok Inventory Accounts payable Inc tax payable (30%). Retained earnings 1,500 Un 1,500 Un Ok Ok Ok Ok Ok ITT
Step by Step Solution
There are 3 Steps involved in it

Get step-by-step solutions from verified subject matter experts