

Question: Can you help answer parts b, c, and d? State of the economy Probability T-bills High Tech Collections U.S. Rubber Market Portfolio Two-Stock Portfolio Recession
Can you help answer parts b, c, and d?
| State of the economy | Probability | T-bills | High Tech | Collections | U.S. Rubber | Market Portfolio | Two-Stock Portfolio |
| Recession | 0.1 | 3.00% | -29.50% | 24.50% | 3.50% | -19.50% | -2.50% |
| Below average | 0.2 | 3 | -9.5 | 10.5 | -16.5 | -5.5 | |
| Average | 0.4 | 3 | 12.5 | -1 | 0.5 | 7.5 | 5.8 |
| Above Average | 0.2 | 3 | 27.5 | -5 | 38.5 | 22.5 | |
| Boom | 0.1 | 3 | 42.5 | -20 | 23.5 | 35.5 | 11.3 |
| Rate of Return | 1.20% | 7.30% | 8.00% | ||||
| Standard Deviation | 11.2 | 18.8 | 15.2 | 4.6 | |||
| CV | 9.8 | 2.6 | 1.9 | 0.8 | |||
| b | -0.5 | 0.88 | |||||
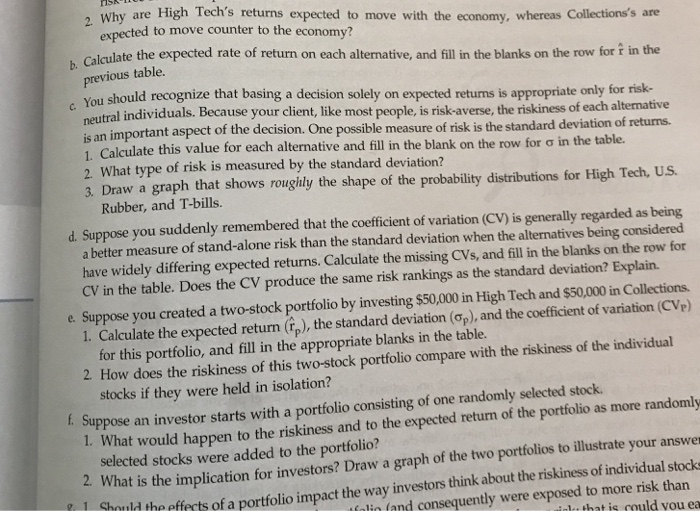
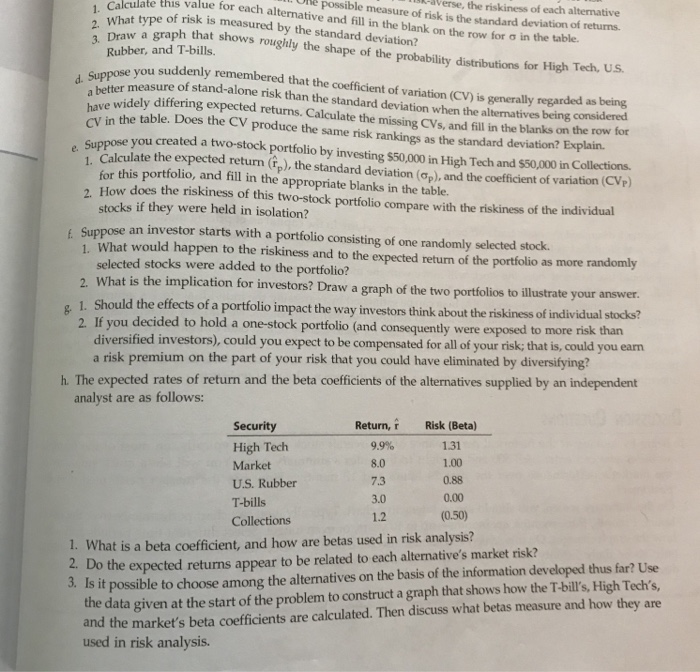
Why are High Tech's returns expected to move with the economy, whereas Collections's are expectedsh Calculate the expected rate of return on each alternative, and fill in the blanks on the row for r in ted to move counter to the economy? b. previous table You should recognize that basing a decision solely on expected returns is appropriate only for risk neutral individuals. Because your client, like most people, is risk-averse, the riskiness of each alternative is an important aspect of 1. Calculate this value for each alternative and fill in the blank on the row for in the table. 2. What type of risk is measured by the standard deviation? the decision. One possible measure of risk is the standard deviation of returns. 3. Draw a graph that shows rougily the shape of the probability distributions for High Tech, US. Rubber, and T-bills. d. Suppose you suddenly remembered that the coefficient of variation (CV) is generally regarded as being a better measure of stand-alone risk than the standard deviation when the alternatives being considered have widely differing expected returns. Calculate the missing CVs, and fill in the blanks on the row for CV in the table. Does the CV produce the same risk rankings as the standard deviation? Explain. e. Suppose you created a two-stock portfolio by investing $50,000 in High Tech and $50,000 in Collections 1. Calculate the expected return (), the standard deviation (op), and the coefficient of variation (CVe) for this portfolio, and fill in the appropriate blanks in the table. 2. How does the riskiness of this two-stock portfolio compare with the riskiness of the individual stocks if they were held in isolation? uppose an investor starts with a portfolio consisting of one randomly selected stock. I. What would happen to the riskiness and to the expected returm of the portfolio as more randomly selected stocks were added to the portfolio? What is the implication for investors? Draw a graph of the two portfolios to illustrate your answer uld the efferts of a portfolio impact the way investors think about the riskiness of individual stocks l.. that ig could vou ea falin fand consequently were exposed to more risk than
Step by Step Solution
There are 3 Steps involved in it

Get step-by-step solutions from verified subject matter experts