

Question: Can you help me answer this from the descriptive analysis chart? Calculate the standard deviation for your data (25.9540659).Describe the range of values that are
Can you help me answer this from the descriptive analysis chart? Calculate the standard deviation for your data (25.9540659).Describe the range of values that are within 3 sigma of the mean and the impact it has on the likelihood of a value being in that range in terms of the variable chosen.
Thank you.
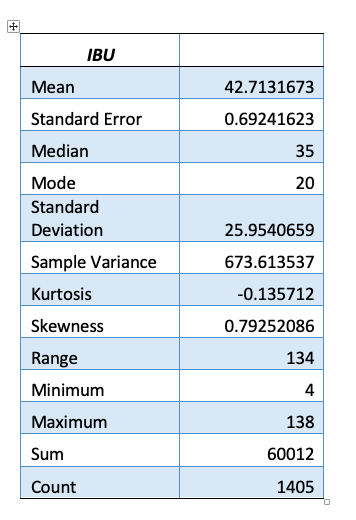
IBU Mean 42.7131673 Standard Error 0.69241623 Median 35 Mode 20 Standard Deviation 25.9540659 Sample Variance 673.613537 Kurtosis -0.135712 Skewness 0.79252086 Range 134 Minimum 4 Maximum 138 Sum 60012 Count 1405
Step by Step Solution
There are 3 Steps involved in it
1 Expert Approved Answer
Step: 1 Unlock

Question Has Been Solved by an Expert!
Get step-by-step solutions from verified subject matter experts
Step: 2 Unlock
Step: 3 Unlock