

Question: can you help me answer this question in the first image I have provided all data Dairy Farmer Daley Palmer is the propreitor of Milky
can you help me answer this question in the first image I have provided all data
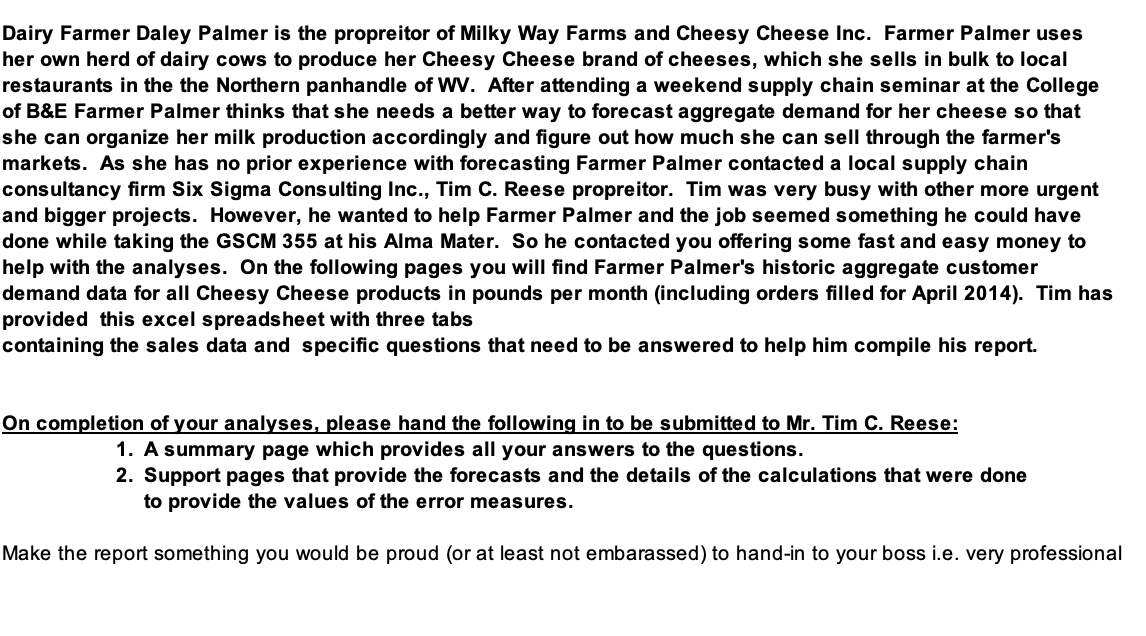
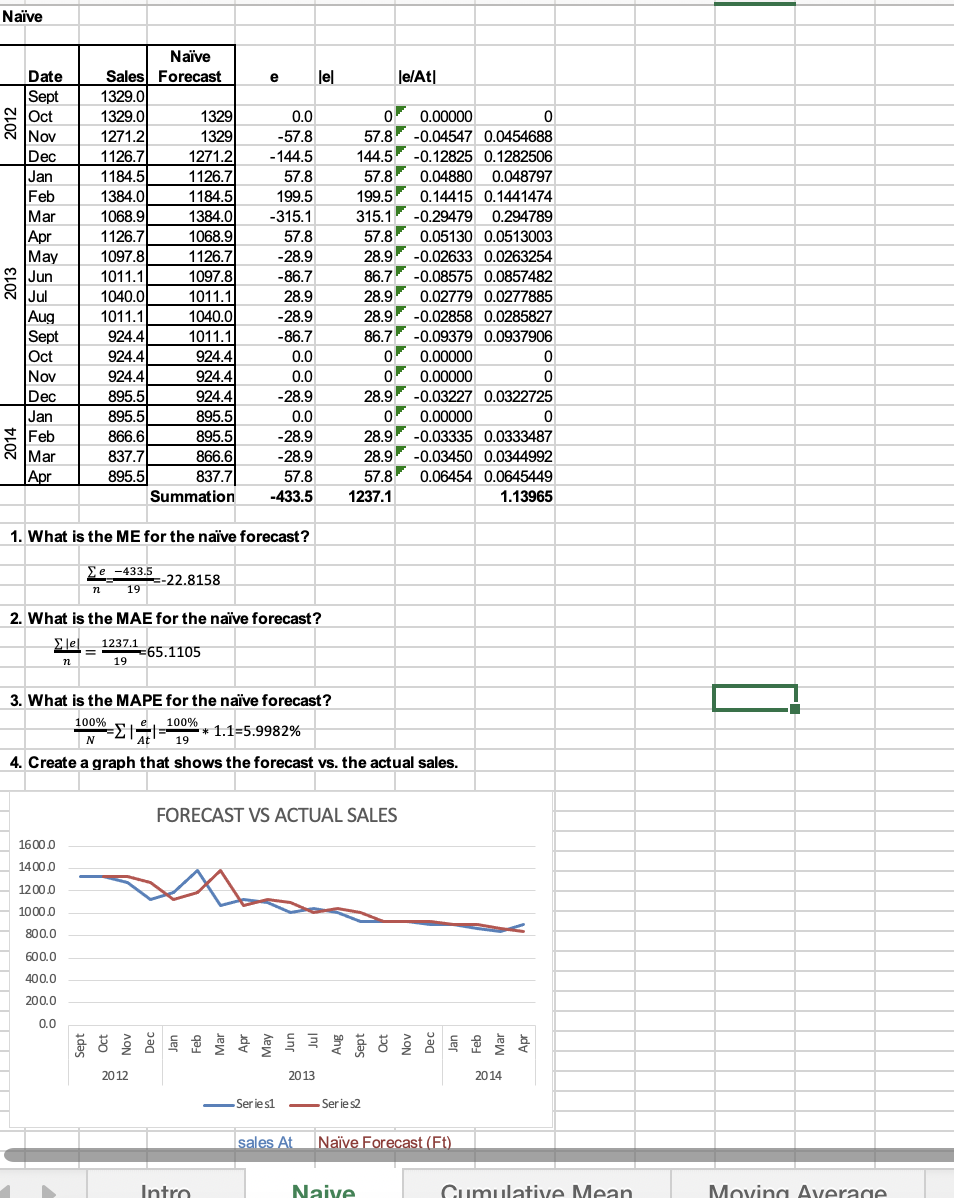
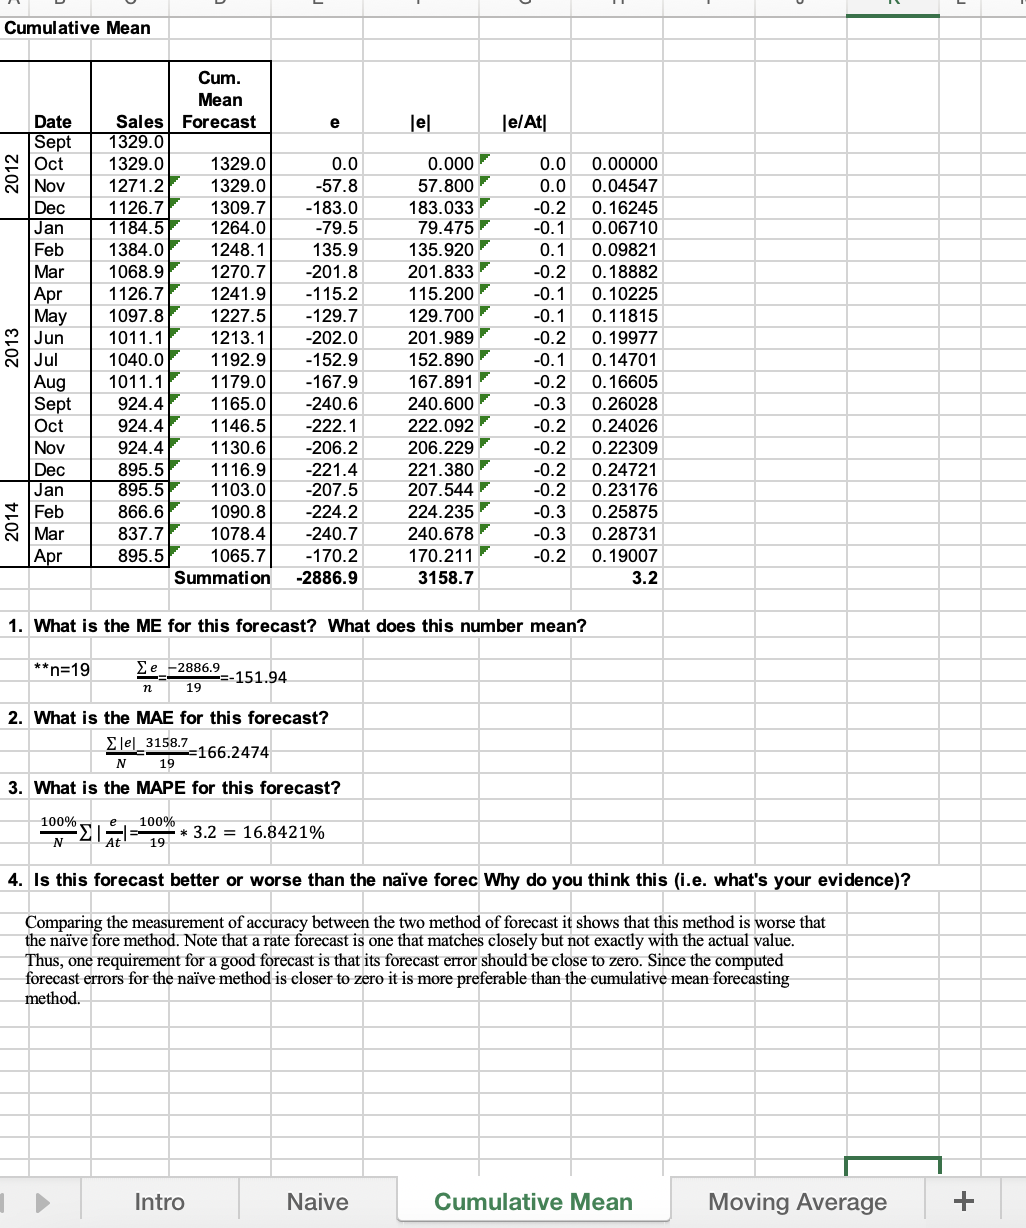
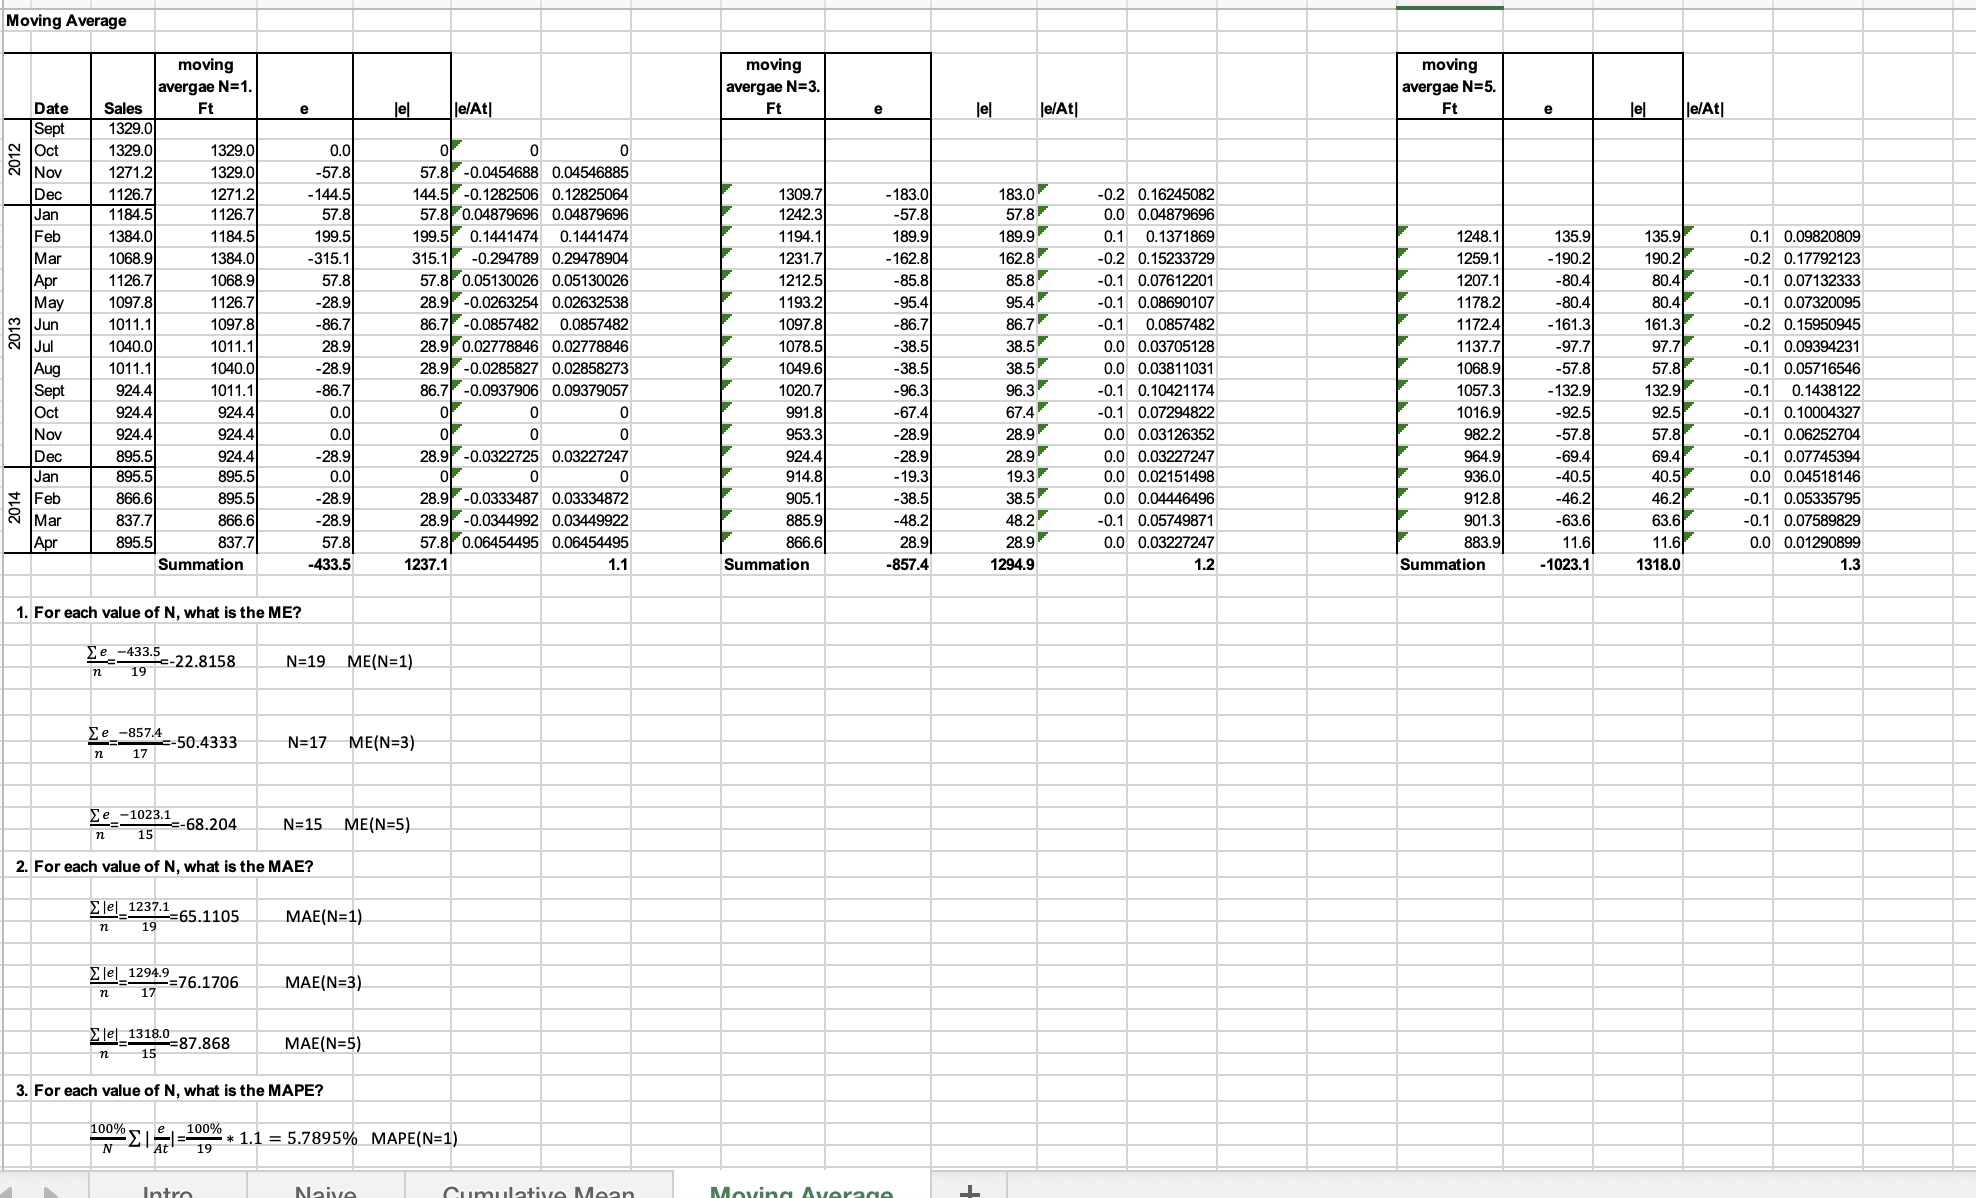
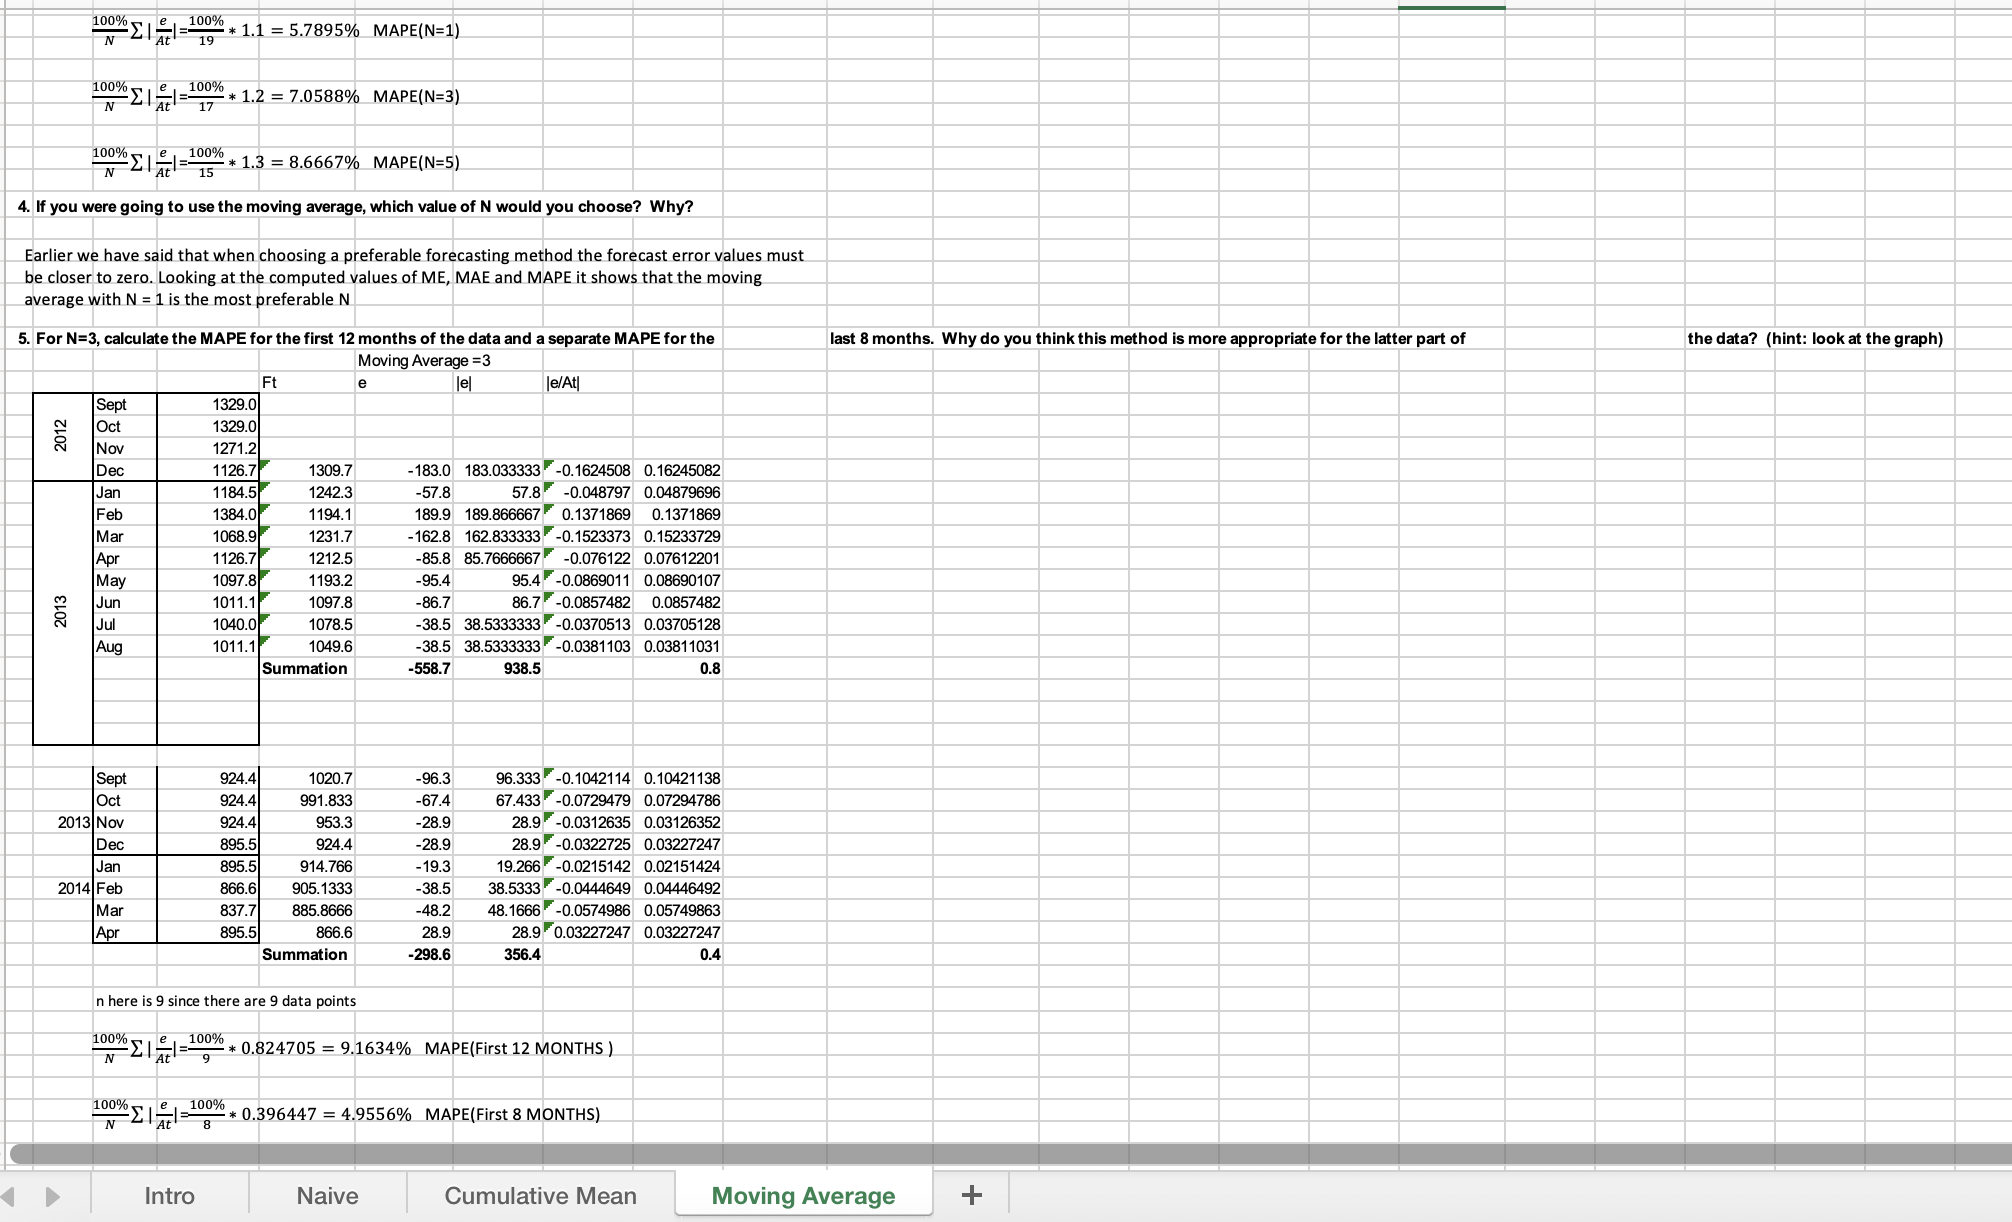
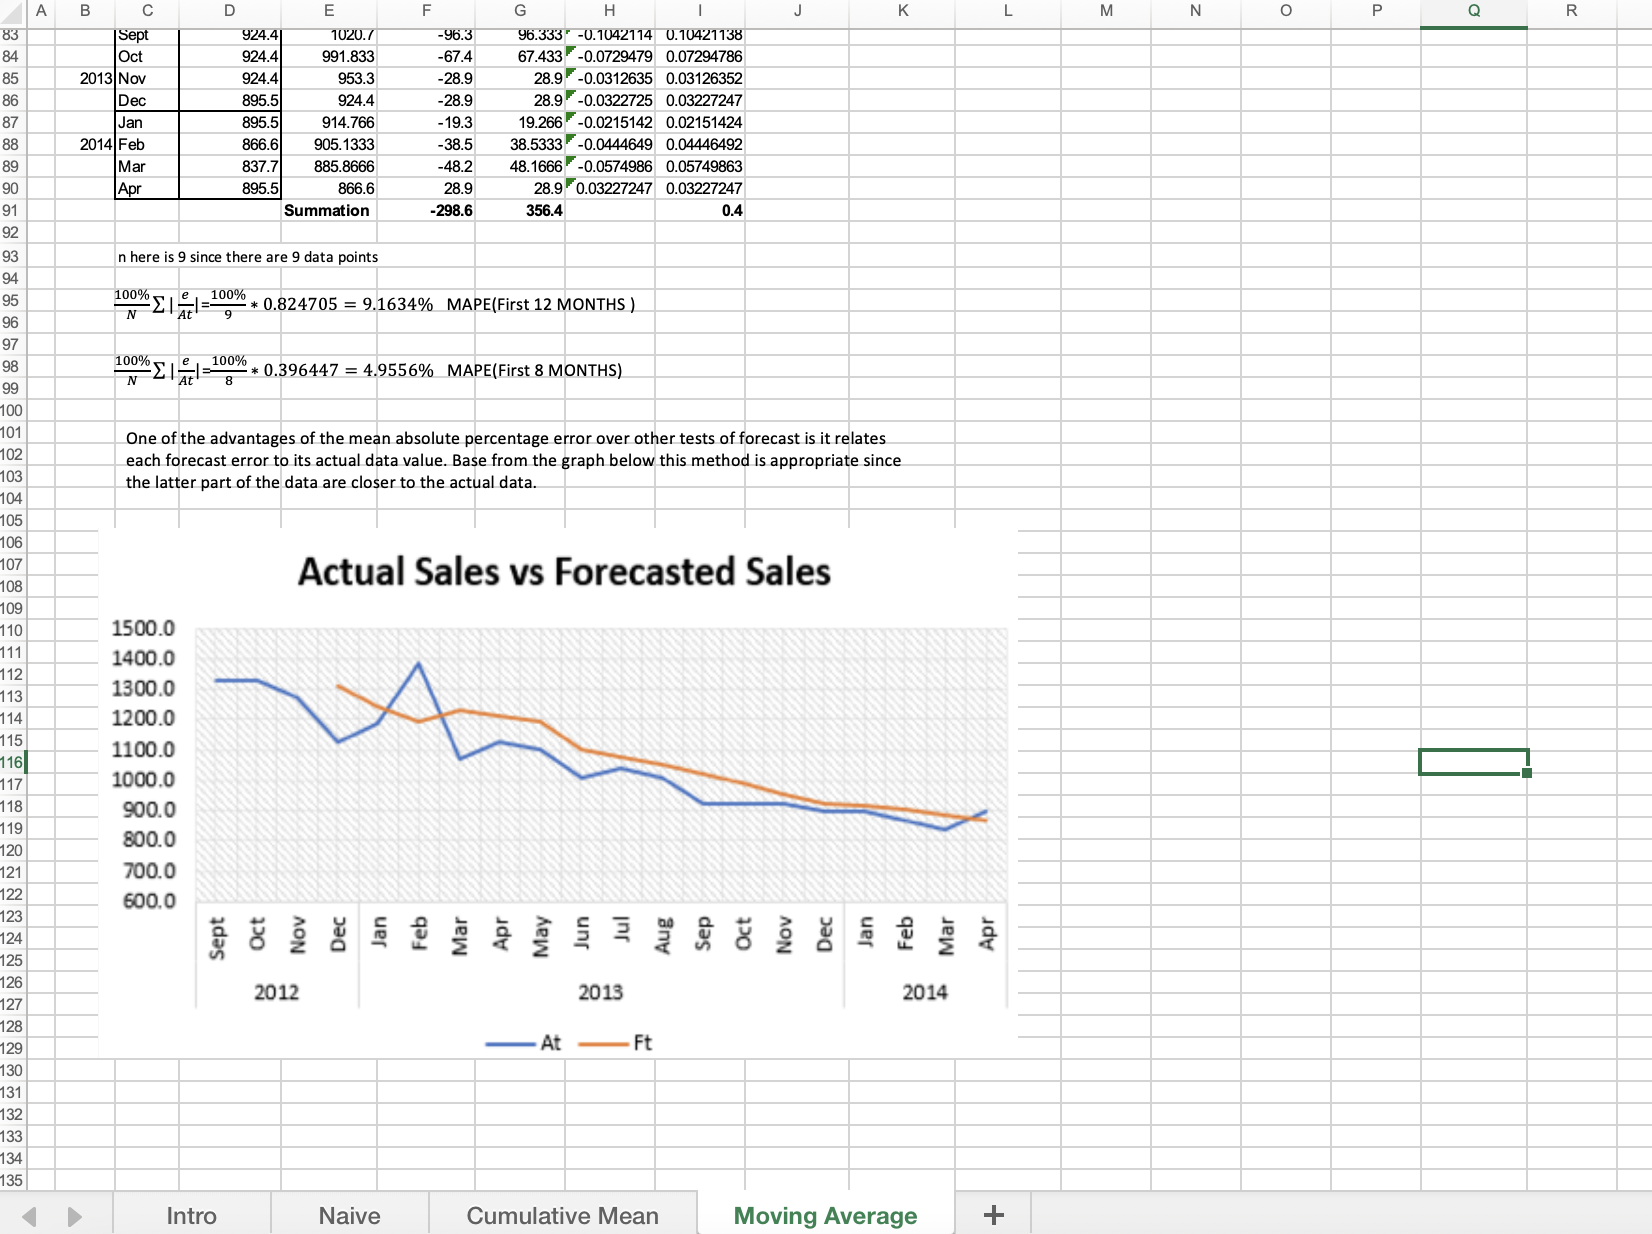
Dairy Farmer Daley Palmer is the propreitor of Milky Way Farms and Cheesy Cheese lnc. Farmer Palmer uses her own herd of dairy cows to produce her Cheesy Cheese brand of cheeses, which she sells in bulk to local restaurants in the the Northern panhandle of WV. After attending a weekend supply chain seminar at the College of B&E Farmer Palmer thinks that she needs a better way to forecast aggregate demand for her cheese so that she can organize her milk production accordingly and gure out how much she can sell through the farmer's markets. As she has no prior experience with forecasting Farmer Palmer contacted a local supply chain consultancy rm Six Sigma Consulting Inc.. Tim C. Reese propreitor. Tim was very busy with other more urgent and bigger projects. However, he wanted to help Farmer Palmer and the job seemed something he could have done while taking the GSCM 355 at his Alma Mater. So he contacted you offering some fast and easy money to help with the analyses. On the following pages you will nd Farmer Palmer's historic aggregate customer demand data for all Cheesy Cheese products in pounds per month (including orders lled for April 2014). Tim has provided this excel spreadsheet with three labs containing the sales data and specic questions that need to be answered to help him compile his report. On completion of your analysesl please hand the following in to be submitted to Mr. Tim C. Reese: 1. A summary page which provides all your answers to the questions. 2. Support pages that provide the forecasts and the details of the calculations that were done to provide the values of the error measures. Make the report something you would be proud (or at least not embarassed) to hand-in to your boss i.e. very professional Naive Naive Date Sales Forecast Jel le/At| Sept 1329.0 Oct 1329.0 1329 0.0 0 0.00000 0 Nov 1271.2 1329 -57.8 57.8 -0.04547 0.0454688 Dec 1126.7 1271.2 -144.5 144.5 -0.12825 0.1282506 Jan 1184.5 1 126.7 57.8 57.8 0.04880 0.048797 Feb 1384.0 1184.5 199.5 199.5 0.14415 0.1441474 Mar 1068.9 1384.0 -315.1 315.1 -0.29479 0.294789 Apr 1126.7 1068.9 57.8 57.8 0.05130 0.0513003 May 1097.8 1 126.7 -28.9 28.9 -0.02633 0.0263254 |Jun 1011.1 1097.8 -86.7 86.7 -0.08575 0.0857482 |Jul 1040.0 1011.1 28.9 28.9 0.02779 0.0277885 Aug 1011.1 1040.0 -28.9 28.9 -0.02858 0.0285827 Sept 924.4 1011.1 -86.7 86.7 -0.09379 0.0937906 Oct 924.4 924.4 0.0 0 0.00000 0 Nov 924.4 924.4 0.0 0.00000 0 Dec 895.5 924.4 28.9 28.9 -0.03227 0.0322725 Jan 895.5 895.5 0.0 0 0.00000 014 Feb 866.6 895.5 -28.9 28.9 -0.03335 0.0333487 Mar 837.7 866.6 -28.9 28.9 -0.03450 0.0344992 | Apr 895.5 837.7 57.8 57.8 0.06454 0.0645449 Summation -433.5 1237.1 1.13965 1. What is the ME for the naive forecast? Ze -433-5_22.8158 19 2. What is the MAE for the naive forecast? Elel 1237.1 65.1105 n 19 3. What is the MAPE for the naive forecast? 100%_100% * 1.1=5.9982% 4. Create a graph that shows the forecast vs. the actual sales. FORECAST VS ACTUAL SALES 1600.0 1400.0 1200.0 10 00.0 80 0.0 600.0 400.0 200.0 0.0 20 12 20 13 20 14 Series1 - Series2 sales At Naive Forecast (Ft)1' u v u |_ I H II I v |\\ |_ Cumulative Mean e lel leMtl 0.0 0.000 r 0.0 0.00000 1329.0 -57.8 57.800 r 0.0 0.04547 1309.7 -183.0 183.033 F -0.2 0.16245 1264.0 -79.5 79.475 " -0.1 0.06710 1248.1 135.9 135.920 r 0.1 0.09821 -201.8 201.833 I? -0.2 0.18882 -115.2 115.200 r -0.1 0.10225 -129.7 129.700 F -0.1 0.11815 1270.7 1241.9 1227.5 '2 1213.1 -202.0 201.989 r -0.2 0.19977 8 1192.9 -152.9 152.890 r -0.1 0.14701 1179.0 -167.9 167.891 r -0.2 0.16605 -240.6 240.600 I? -0.3 0.26028 -222.1 222.092 r -0.2 0.24026 -206.2 206.229 F -0.2 0.22309 -221.4 221.380.Ir -0.2 0.24721 -207.5 207.544" -0.2 0.23176 -224.2 224.235 r -0.3 0.25875 1078.4 -240.7 240.678 r -0.3 0.28731 1065.7 -170.2 170.211 " -0.2 0.19007 Summation 4886.9 3158.7 3.2 1165.0 1146.5 1130.6 1116.9 1103.0 1090.8 2014 1. What Is the ME for this forecast? What does this number mean? **n=19 h'2886'9-45134 n 19 2. What Is the MAE for this forecast? mszdu N 19 3. What Is the MAPE for this forecast? 100% e 100%! 4.. Is this forecast better or worse than the naive forec Why do you think this (Le. what's your evidence)? Conmaringthemeasurementofaccuracyhehweenthenvomethodofforecastitshowsthatthismethodisworse that the naive fore method. Note that a rate forecast is one that matches closely but not exactly with the actual value. Thus, one requirement for a good forecast is that its forecast error shouldhe close to zero. Since the computed forecast errors for the naive method is closer to zero it is me preferable than the mmmlative mean forecasting method. I ) Intro Naive Cumulative Mean Moving Average + Moving Average moving moving moving avergae N=1. avergae N=3. avergae N=5. Date Sales Ft le le/At F e le Je/At] F lel |le/At| Sept 1329.0 |Oct 1329.0 1329. 0. 0 |Nov 1271.2 1329.0 -57.8 57.8 -0.0454688 0.04546885 Dec 1126.7 1271.2 - 144.5 144.5 -0.1282506 0.12825064 1309.7 -183.0 183.0 -0.2 0.16245082 Jan 1184.5 1126.7 57.8 57.8 0.04879696 0.04879696 1242.3 -57.8 57.8 0.0 0.04879696 Feb 1384.0 1184.5 199.5 199.5 0.1441474 0.1441474 1194. 189.9 189.9 0.1 0.1371869 1248.1 135.9 135.9 0.1 0.09820809 Mar 1068.9 1384.0 315.1 315.1 -0.294789 0.29478904 1231.7 162. 62.8 0.2 0.15233729 1259.1 -190.2 190.2 -0.2 0.1779212 Apr 1126.7 1068.9 57.8 57.8 0.05130026 0.05130026 1212.5 -85.8 85.8 -0.1 0.07612201 1207.1 -80.4 80.4 -0.1 0.07132333 May 1097.8 1126.7 -28.9 28.9 -0.0263254 0.02632538 1193.2 -95.4 95.4 -0.1 0.08690107 1178.2 -80.4 80.4 -0.1 0.07320095 Jur 1011.1 1097.8 -86.7 86.7 -0.0857482 0.0857482 1097. -86.7 86.7 -0.1 0.0857482 1172.4 161.3 161.3 -0.2 0.15950 Ju 1040.0 011.1 28.9 28.9 0.02778846 0.02778846 078.5 -38.5 38.5 0.0 0.03705128 1137.7 -97.7 97.7 -0.1 0.09394231 Aug 1011.1 1040.0 .28.9 28.9 -0.0285827 0.02858273 1049.6 -38.5 38.5 0.0 0.03811031 1068.9 -57.8 57.8 -0.1 0.05716546 Sept 924.4 1011.1 86.7 36.7 -0.0937906 0.09379057 1020.7 -96.3 96.3 -0.1 0.10421174 1057.3 132.9 132.9 -0.1 0.1438122 Oct 924.4 924.4 0.0 0 991.8 -67.4 67.4 0.1 0.07294822 1016.9 -92.5 92.5 -0.1 0.10004327 Nov 924.4 924.4 0.0 of 0 0 953.3 -28.9 28.9 0.0 0.03126352 982.2 57.8 57.8 -0.1 0.06252704 Dec 895.5 924.4 28.9 28.9 -0.0322725 0.03227247 924.4 -28.9 28.9 0.0 0.03227247 964.9 .69.4 69.4 -0.1 0.07745394 Jan 895.5 895.5 0.0 0 914.8 -19.3 19.3 0.0 0.02151498 936.0 -40.5 40.5 0.0 0.04518146 Feb 866.6 895.5 -28.9 28.9 -0.0333487 0.03334872 905.1 -38.5 38.5 0.0 0.04446496 912.8 46.2 46.2 -0.1 0.05335795 Mar 837.7 866.6 .28.9 28.9 -0.0344992 0.03449922 885.9 48.2 48.2 -0.1 0.05749871 901.3 63.6 3.6 -0.1 0.07589829 Ap 895.5 837.7 57.8 57.8 0.06454495 0.06454495 866.6 28.9 28.9 0.0 0.03227247 883.9 11.6 11.6 0.01290899 Summation -433.5 1237.1 1.1 Summation -857.4 1294.9 1.2 Summation -1023.1 1318.0 1.3 1. For each value of N, what is the ME? Ce -433-2-22.8158 n 19 N=19 ME(N=1) Ce_-857.4-50.4333 N=17 ME(N=3) 17 Ce -1023.16 -68.204 15 N=15 ME(N=5) 2. For each value of N, what is the MAE? Cle|_1237-3-65.1105 n MAE(N=1) 19 Cle|_1294.97 =76.1706 17 MAE(N=3) Ciel 13180-87.868 15 MAE(N=5) 3. For each value of N, what is the MAPE? 1 100% * 1.1 = 5.7895% MAPE(N=1)N 100% e -20070 * 1.1 = 5.7895% MAPE(N=1) 19 100% 17 100% * 1.2 = 7.0588% MAPE(N=3) EL-= 00 * 1.3 = 8.6667% MAPE(N=5) 4. If you were going to use the moving average, which value of N would you choose? Why? Earlier we have said that when choosing a preferable forecasting method the forecast error values must be closer to zero. Looking at the computed values of ME, MAE and MAPE it shows that the moving average with N = 1 is the most preferable N 5. For N=3, calculate the MAPE for the first 12 months of the data and a separate MAPE for the last 8 months. Why do you think this method is more appropriate for the latter part of the data? (hint: look at the graph) Moving Average =3 Ft lel le/At] Sept 1329.0 |Oct 1329. 2012 Nov 1271.2 Dec 1126.7 1309.7 -183.0 183.033333 -0.1624508 0.16245082 Jan 184.5 1242. -57.8 57.8 -0.048797 0.04879696 Feb 1384.0 1194.1 189.9 189.866667 0.1371869 0.1371869 Mar 1068.9 1231.7 162.8 162.833333 -0.1523373 0.15233729 Apr 1126.7 1212.5 -85.8 85.7666667 -0.076122 0.07612201 |May 1097.8 1193.2 -95.4 5.4 -0.0869011 0.08690107 Jun 1011.1 1097.8 -86.7 36.7 -0.0857482 0.0857482 2013 Jul 1040.0 1078.5 38.5 38.5333333 -0.0370513 0.03705128 Aug 1011.1 049.6 38.5 38.5333333 -0.0381103 0.03811031 Summation -558.7 938.5 0.8 Sept 924.4 1020. -96.3 96.333 -0.1042114 0.10421138 Oct 924.4 991.833 -67.4 67.433 -0.0729479 0.07294786 2013 Nov 924.4 953.3 -28.9 28.9 -0.0312635 0.03126352 Dec 895.5 924.4 -28.9 28.9 -0.0322725 0.03227247 Jan 895.5 914.766 19.3 19.266 -0.0215142 0.02151424 2014 Feb 866.6 905.1333 38.5 38.5333 -0.0444649 0.04446492 |Mar 837.7 885.8666 48.2 48. 1666 -0.0574986 0.05749863 Apr 895.5 866.6 28.9 28.9 0.03227247 0.03227247 Summation -298.6 356.4 0.4 In here is 9 since there are 9 data points 100% e -100% N At 9 * 0.824705 = 9.1634% MAPE(First 12 MONTHS ) 100% N 8 * 0.396447 = 4.9556% MAPE(First 8 MONTHS) Intro Naive Cumulative Mean Moving Average +N O Q R G K M P B E 83 Sept 924.4 1020.7 -96.3 96.333 -0.1042114 0.10421138 84 Oct 924.4 991.833 -67.4 67.433 -0.0729479 0.07294786 85 2013 Nov 924.4 953.3 28.9 28.9 -0.0312635 0.03126352 86 Dec 395.5 924.4 28.9 28.9 -0.0322725 0.03227247 87 Jan 895.5 914.766 -19.3 19.266 -0.0215142 0.02151424 88 2014 Feb 866.6 905.1333 38.5 38.5333 -0.0444649 0.04446492 89 |Mar 837.7 885.8666 48.2 48. 1666 -0.0574986 0.05749863 90 Apr 895.5 366.6 28.9 28.9 0.03227247 0.03227247 91 Summation -298.6 356.4 0.4 92 93 In here is 9 since there are 9 data points 94 95 100% 96 N e - 100% * 0.824705 = 9.1634% MAPE(First 12 MONTHS ) 97 98 100% e 100% 1070 * 0.396447 = 4.9556% MAPE(First 8 MONTHS) 99 N 8 100 101 One of the advantages of the mean absolute percentage error over other tests of forecast is it relates 102 each forecast error to its actual data value. Base from the graph below this method is appropriate since 103 the latter part of the data are closer to the actual data. 105 106 Actual Sales vs Forecasted Sales 8 8 1500.0 1400.0 1300.0 1200.0 1100.0 1000.0 900.0 800.0 700.0 600.0 Mar May Sept 2012 2013 2014 - At . Ft Intro Naive Cumulative Mean Moving Average +
Step by Step Solution
There are 3 Steps involved in it

Get step-by-step solutions from verified subject matter experts