

Question: Can you help me answer those questions based on what you understand from the graph you should answer to the question accordingly this is all
Can you help me answer those questions based on what you understand from the graph you should answer to the question accordingly
this is all the teacher Told us so I don't know what relevant information to add
hope you understand
Can you help me answer those questions
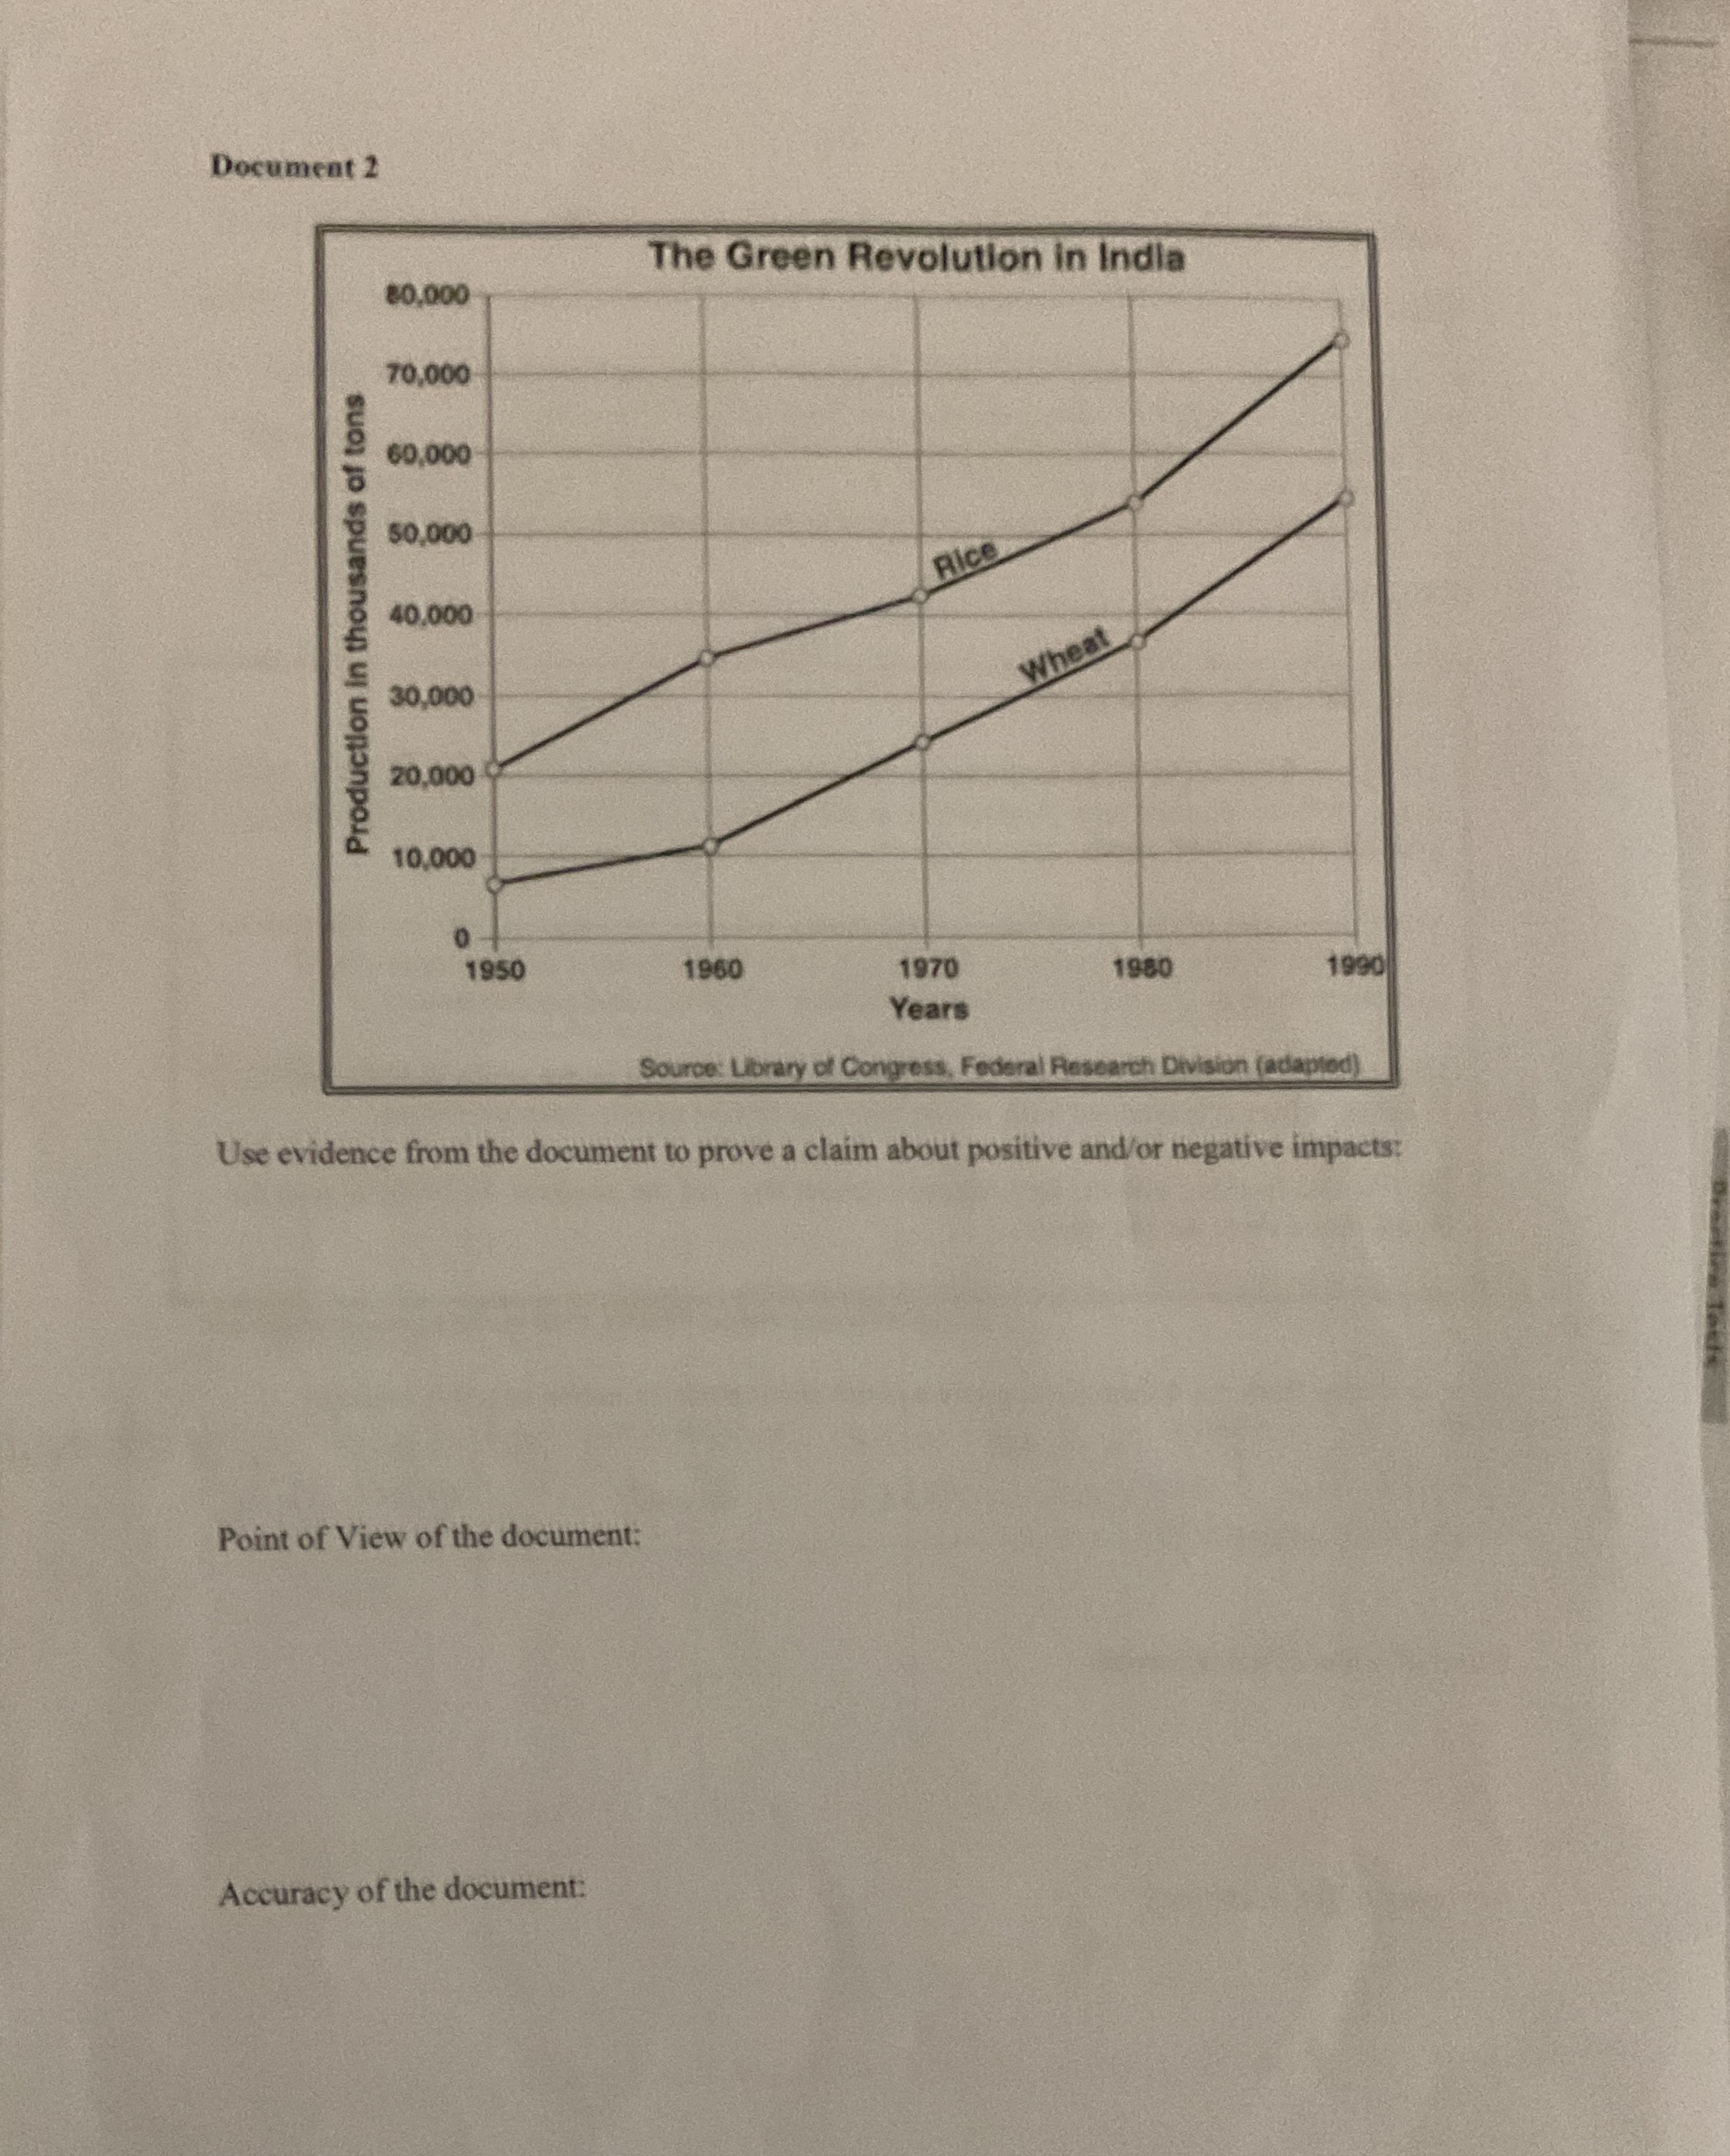
Document 2 The Green Revolution in India 80.000 70,000 60,000 50,000 Rice 40,000 Production in thousands of tons Wheat 30,000 20,000 10,000 1950 1960 1970 1980 1990 Years Source: Library of Congress, Federal Research Division (adapted) Use evidence from the document to prove a claim about positive and/or negative impacts: Point of View of the document: Accuracy of the document
Step by Step Solution
There are 3 Steps involved in it

Get step-by-step solutions from verified subject matter experts