

Question: Can you help me b) Construct the probability histogram for this data on your graph paper. Please Be Discrete Learning Task Name_ Date 9/26/23 c)
Can you help me
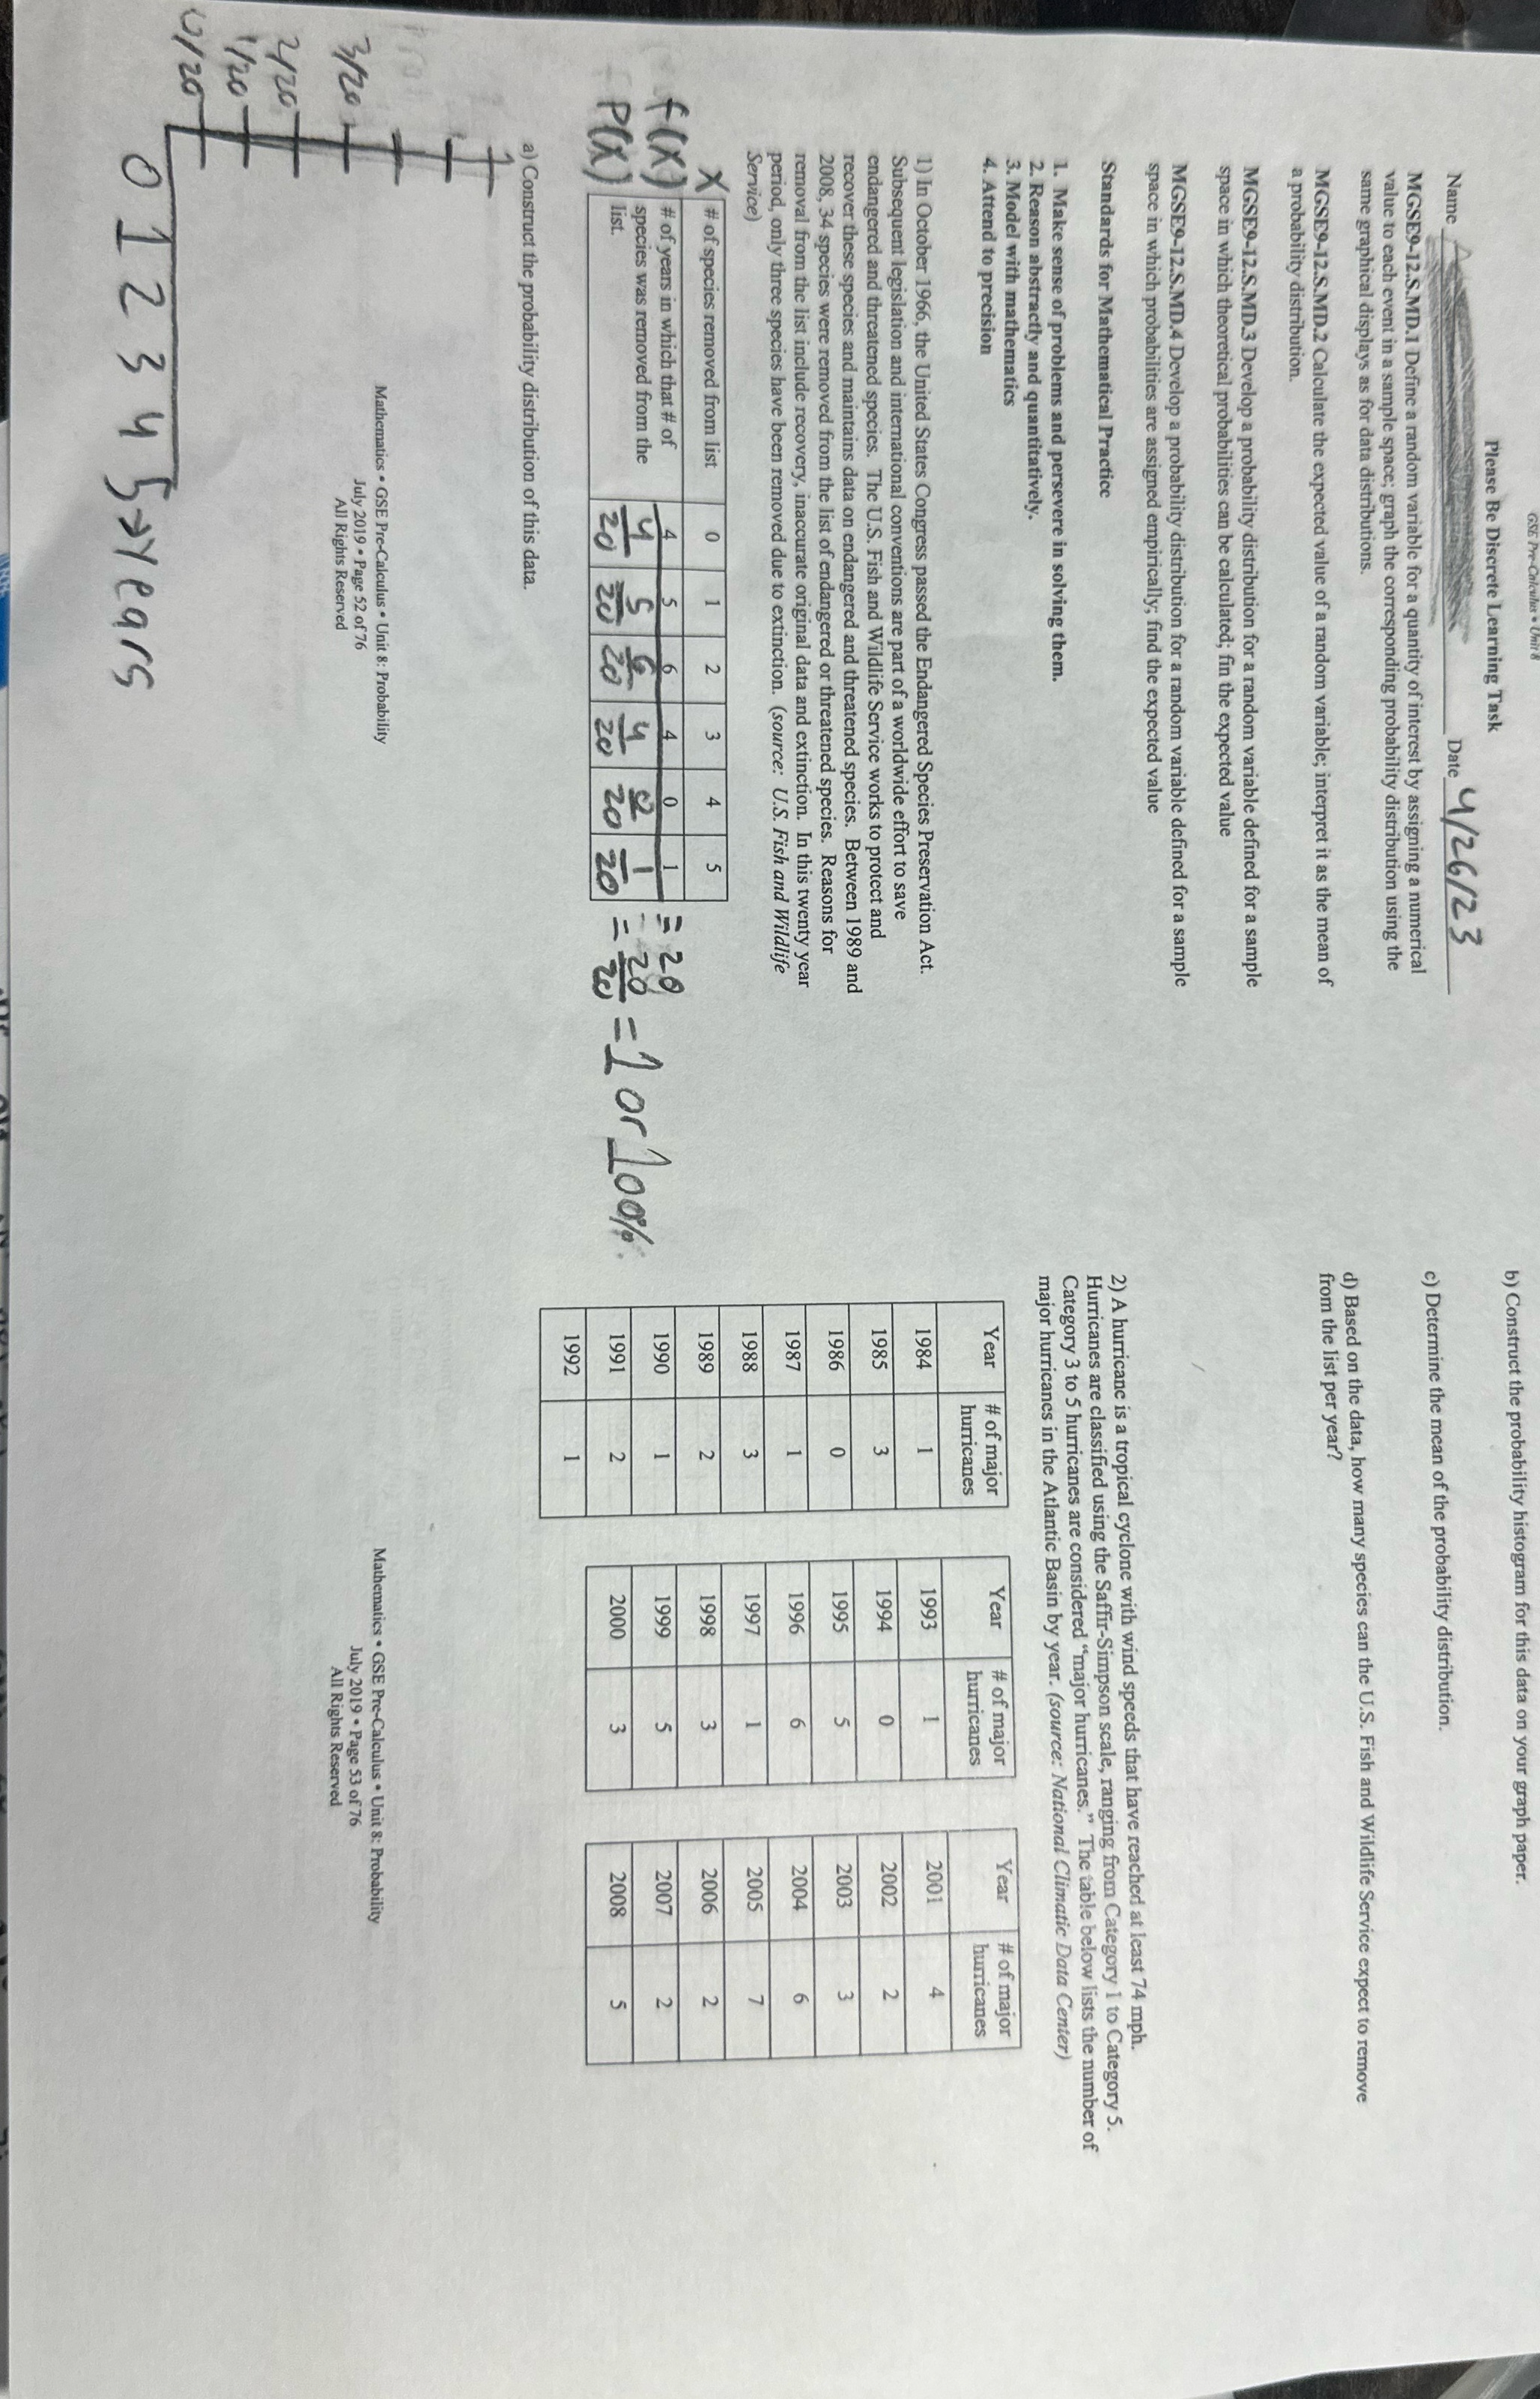
b) Construct the probability histogram for this data on your graph paper. Please Be Discrete Learning Task Name_ Date 9/26/23 c) Determine the mean of the probability distribution. MGSE9-12.S.MD.1 Define a random variable for a quantity of interest by assigning a numerical value to each event in a sample space; graph the corresponding probability distribution using the same graphical displays as for data distributions. d) Based on the data, how many species can the U.S. Fish and Wildlife Service expect to remove MGSE9-12.S.MD.2 Calculate the expected value of a random variable; interpret it as the mean of from the list per year? a probability distribution. MGSE9-12.S.MD.3 Develop a probability distribution for a random variable defined for a sample space in which theoretical probabilities can be calculated; fin the expected value MGSE9-12.S.MD.4 Develop a probability distribution for a random variable defined for a sample space in which probabilities are assigned empirically; find the expected value 2) A hurricane is a tropical cyclone with wind speeds that have reached at least 74 mph. Standards for Mathematical Practice Hurricanes are classified using the Saffir-Simpson scale, ranging from Category 1 to Category 5. Category 3 to 5 hurricanes are considered "major hurricanes." The table below lists the number of 1. Make sense of problems and persevere in solving them. 2. Reason abstractly and quantitatively. major hurricanes in the Atlantic Basin by year. (source: National Climatic Data Center) 3. Model with mathematics 4. Attend to precision Year # of major Year # of major Year # of major hurricanes hurricanes hurricanes 1) In October 1966, the United States Congress passed the Endangered Species Preservation Act. 984 1993 2001 Subsequent legislation and international conventions are part of a worldwide effort to save endangered and threatened species. The U.S. Fish and Wildlife Service works to protect and 1985 1994 O 2002 m recover these species and maintains data on endangered and threatened species. Between 1989 and O 2008, 34 species were removed from the list of endangered or threatened species. Reasons for 1986 1995 2003 m removal from the list include recovery, inaccurate original data and extinction. In this twenty year 1987 1996 2004 period, only three species have been removed due to extinction. (source: U.S. Fish and Wildlife Service) 1988 1997 2005 # of species removed from list 0 2 1989 N 1998 2006 N f (X ) # of years in which that # of =1 or 100%. 1990 1999 IN 2007 species was removed from the P( X ) list. 20 zo 1991 N 2000 2008 in 1992 a) Construct the probability distribution of this data. Mathematics . GSE Pre-Calculus . Unit 8: Probability 3/20 July 2019 . Page 52 of 76 Mathematics . GSE Pre-Calculus . Unit 8: Probability All Rights Reserved July 2019 . Page 53 of 76 All Rights Reserved 2/20 0/ 20 0 12 3 4 5 yearsGeorgia Department of Education Georgia Standards of Excellence Framework GSE Pre Calcules . Unit & a) Construct a frequency table for this data. b) Construct the probability distribution for this data. c) Construct a probability histogram for this data on your graph paper. d) Determine the mean of the probability distribution. e) Based on the data, how many hurricanes can be expected in the Atlantic Basin in a year
Step by Step Solution
There are 3 Steps involved in it

Get step-by-step solutions from verified subject matter experts