

Question: Can you help me draw a graph? Thanks. 8 . Import quotas Kazakhstan is an apple producer as well as an importer of apples. Suppose
Can you help me draw a graph? Thanks.
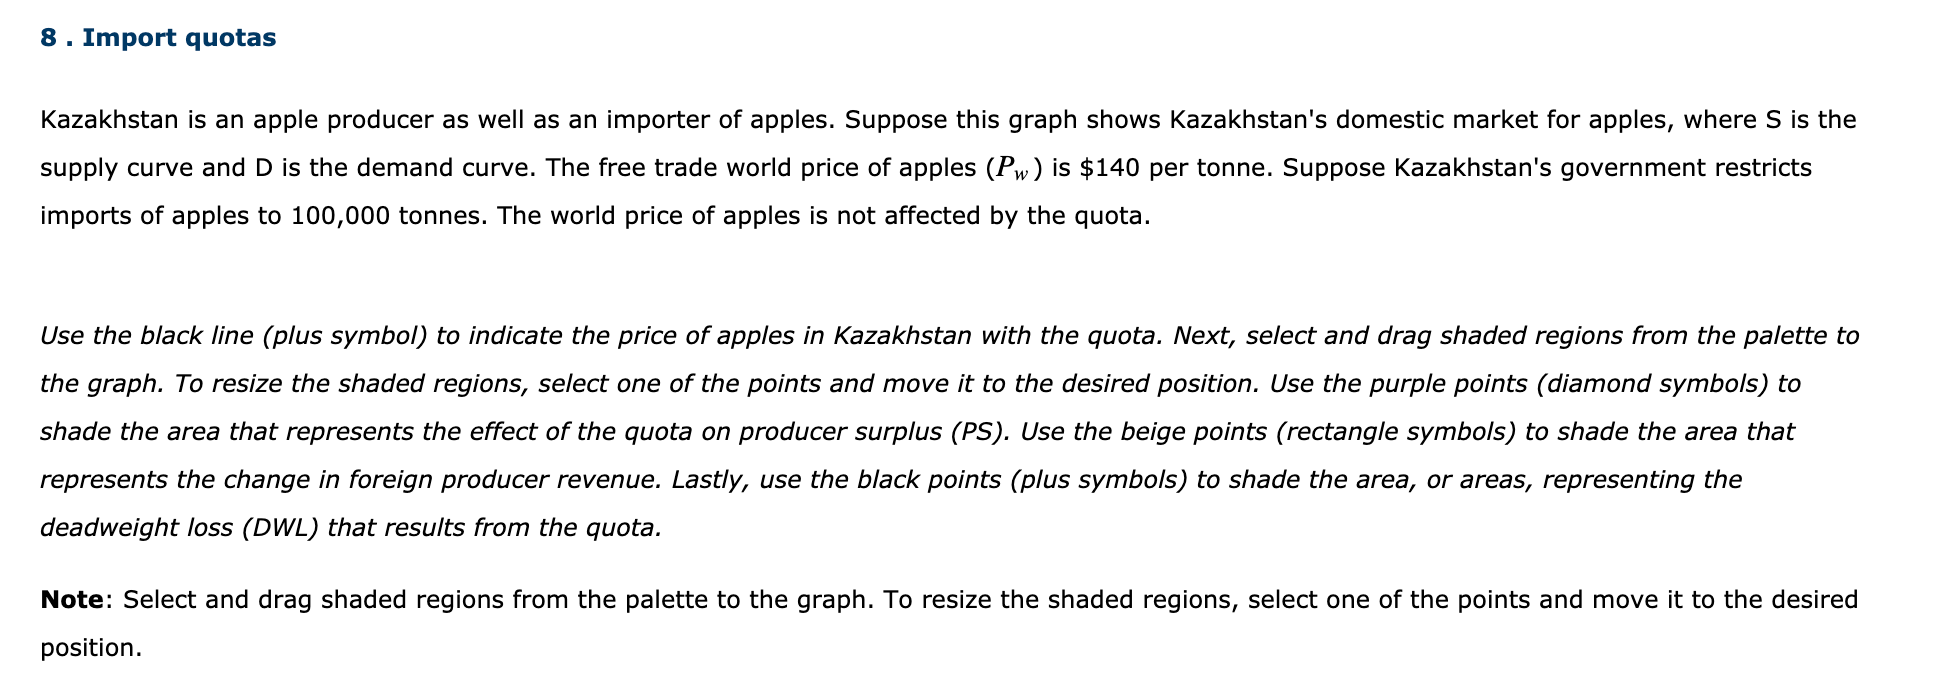

8 . Import quotas Kazakhstan is an apple producer as well as an importer of apples. Suppose this graph shows Kazakhstan's domestic market for apples, where S is the supply curve and D is the demand curve. The free trade world price of apples (PW) is $140 per tonne. Suppose Kazakhstan's government restricts imports of apples to 100,000 tonnes. The world price of apples is not affected by the quota. Use the black line (plus symbol) to indicate the price of apples in Kazakhstan with the quota. Next, select and drag shaded regions from the palette to the graph. To resize the shaded regions, select one of the points and move it to the desired position. Use the purple points (diamond symbols) to shade the area that represents the effect of the quota on producer surplus (PS). Use the beige points (rectangle symbols) to shade the area that represents the change in foreign producer revenue. Lastly, use the black points (plus symbols) to shade the area, or areas, representing the deadweight loss (DWL) that results from the quota. Note: Select and drag shaded regions from the palette to the graph. To resize the shaded regions, select one of the points and move it to the desired position. PRICE (Dollars per tonne) 280 260 240 220 200 180 160 140 120 100 80 40 60 30 100 120 140 160 QUANTITY (Thousands of tonnes) 180 200 + Price with Quota k Change in PS I Change in Foreign Producer Revenue 1 DWL
Step by Step Solution
There are 3 Steps involved in it

Get step-by-step solutions from verified subject matter experts