

Question: can you help me explaining with the graphics please A car insurance company compiled the following information from a recent survey. 75% of drivers carefully
can you help me explaining with the graphics please
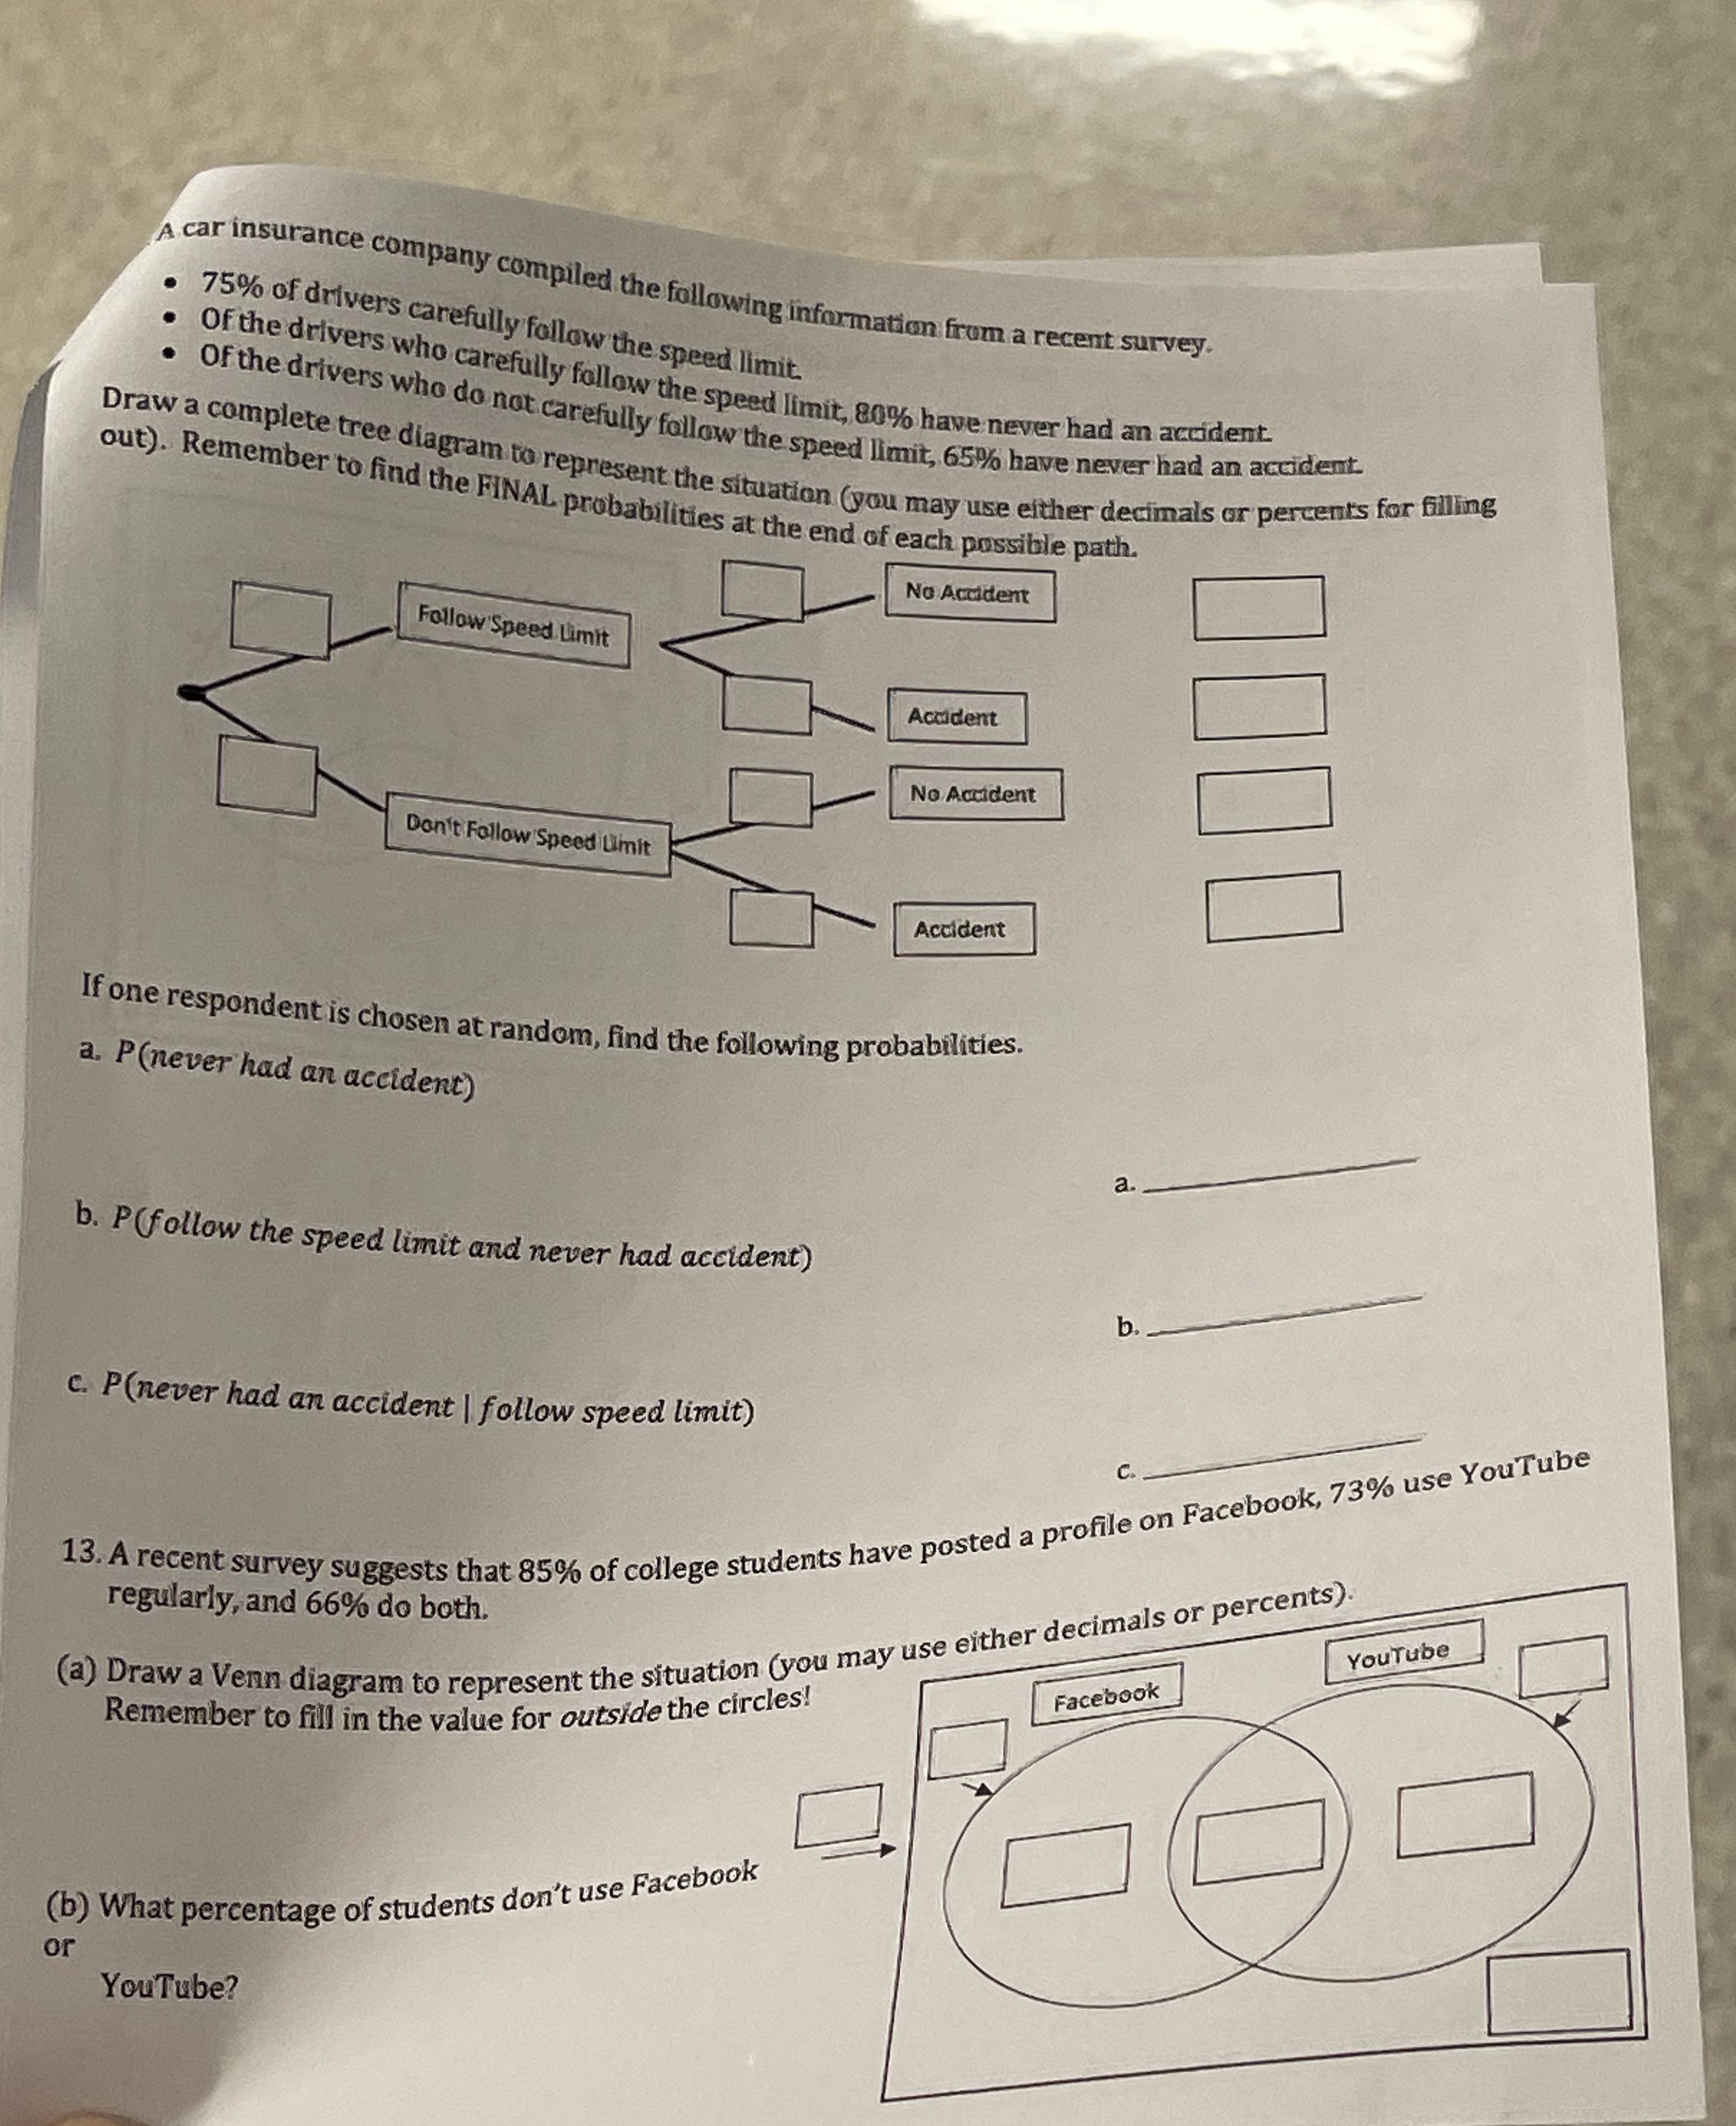
A car insurance company compiled the following information from a recent survey. 75% of drivers carefully follow the speed limit Of the drivers who carefully follow the speed limit, 80% have never had an accident . Of the drivers who do not carefully follow the speed limit, 65% have never had an accident. Draw a complete tree diagram to represent the situation (you may use either decimals or percents for filling out). Remember to find the FINAL probabilities at the end of each possible path. No Accident Follow Speed Limit Accident No Accident Don't Follow Speed Umit Accident If one respondent is chosen at random, find the following probabilities. a. P(never had an accident) a. b. P(follow the speed limit and never had accident) b. c. P(never had an accident | follow speed limit) 13. A recent survey suggests that 85% of college students have posted a profile on Facebook, 73% use YouTube regularly, and 66% do both. (a) Draw a Venn diagram to represent the situation (you may use either decimals or percents) YouTube Facebook Remember to fill in the value for outside the circles! (b) What percentage of students don't use Facebook or You Tube
Step by Step Solution
There are 3 Steps involved in it

Get step-by-step solutions from verified subject matter experts